「AntV」L7地理可视化:从入门到实践
1. 前言
这是一篇由浅入深的AntV L7的学习笔记总结,记述了从了解到使用的一些过程
本文所使用的数据(包括数据处理过程)和代码均有详细描述,所有案例均可复现,甚至大部分代码可直接使用
如果喜欢分页阅读,可以参考下列目录:
- 「AntV」L7 快速入门示例 - 当时明月在曾照彩云归 - 博客园 (cnblogs.com)
- 「AntV」Vue3与TS框架下使用L7 - 当时明月在曾照彩云归 - 博客园 (cnblogs.com)
- 「AntV」全球AQI数据获取与L7可视化 - 当时明月在曾照彩云归 - 博客园 (cnblogs.com)
- 「AntV」路网数据获取与L7可视化 - 当时明月在曾照彩云归 - 博客园 (cnblogs.com)
- 「AntV」景点轨迹数据获取与L7可视化 - 当时明月在曾照彩云归 - 博客园 (cnblogs.com)
- 「AntV」基于众源轨迹数据的三维路网生成与L7可视化 - 当时明月在曾照彩云归 - 博客园 (cnblogs.com)
因笔者水平有限,如有错误,敬请指正
2. 概述
L7 地理空间数据可视分析引擎是一种基于 WebGL 技术的地理空间数据可视化引擎,可以用于实现各种地理空间数据可视化应用。L7 引擎支持多种数据源和数据格式,包括 GeoJSON、CSV等,可以快速加载和渲染大规模地理空间数据。L7 引擎还提供了丰富的可视化效果和交互功能,包括热力图、等高线图、鼠标交互等,可以帮助用户更好地理解和分析地理空间数据
L7 官网:蚂蚁地理空间数据可视化 | AntV (antgroup.com)
L7 GitHub 仓库:antvis/L7: ?? Large-scale WebGL-powered Geospatial Data Visualization analysis engine (github.com)
L7 官方教程:简介 | L7 (antgroup.com)
L7 官方示例:所有图表 | L7 (antgroup.com)
L7 API文档:场景 Scene | L7 (antgroup.com)
3. 快速入门
3.1 入门示例
L7的主要特点是使用WebGL绘制地图数据,此处主要描述的是L7作为前端GIS库基础功能使用
通过CDN的方式可以快速引入L7:
<script src = 'https://unpkg.com/@antv/l7'></script>
通过NPM的方式引入L7可参考:
npm install @antv/l7
简单起见,下面使用CDN方式引入
3.1.1 加载地图
加载地图:
<!DOCTYPE html>
<html lang="en">

<head>
  <meta charset="UTF-8">
  <meta http-equiv="X-UA-Compatible" content="IE=edge">
  <meta name="viewport" content="width=device-width, initial-scale=1.0">
  <title>Document</title>
  <script src='https://unpkg.com/@antv/l7'></script>
</head>

<body>
  <div id="map"></div>
  <script>
    const scene = new L7.Scene({
      id: 'map',
      map: new L7.GaodeMap({
        style: 'dark',
        center: [110.770672, 34.159869]
      }),
    });
  </script>
</body>

</html>
结果如下:
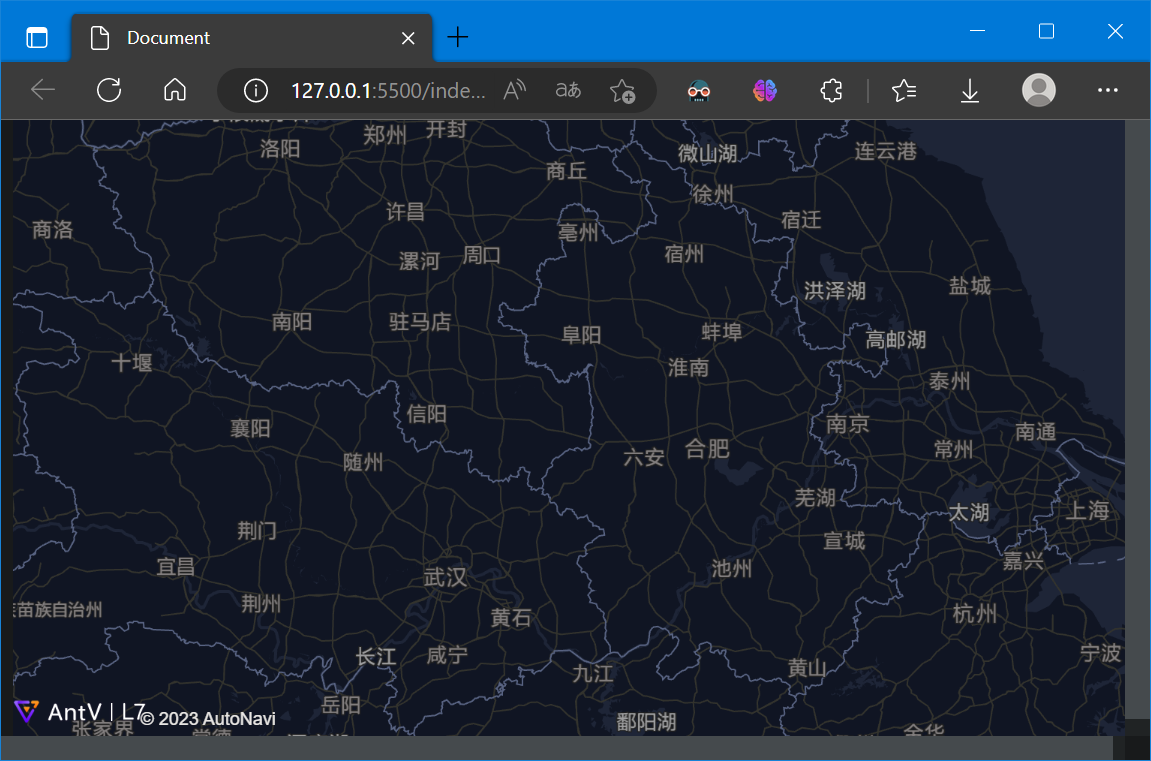
L7内置了高德底图API,测试环境下可以直接使用
3.1.2 加载底图
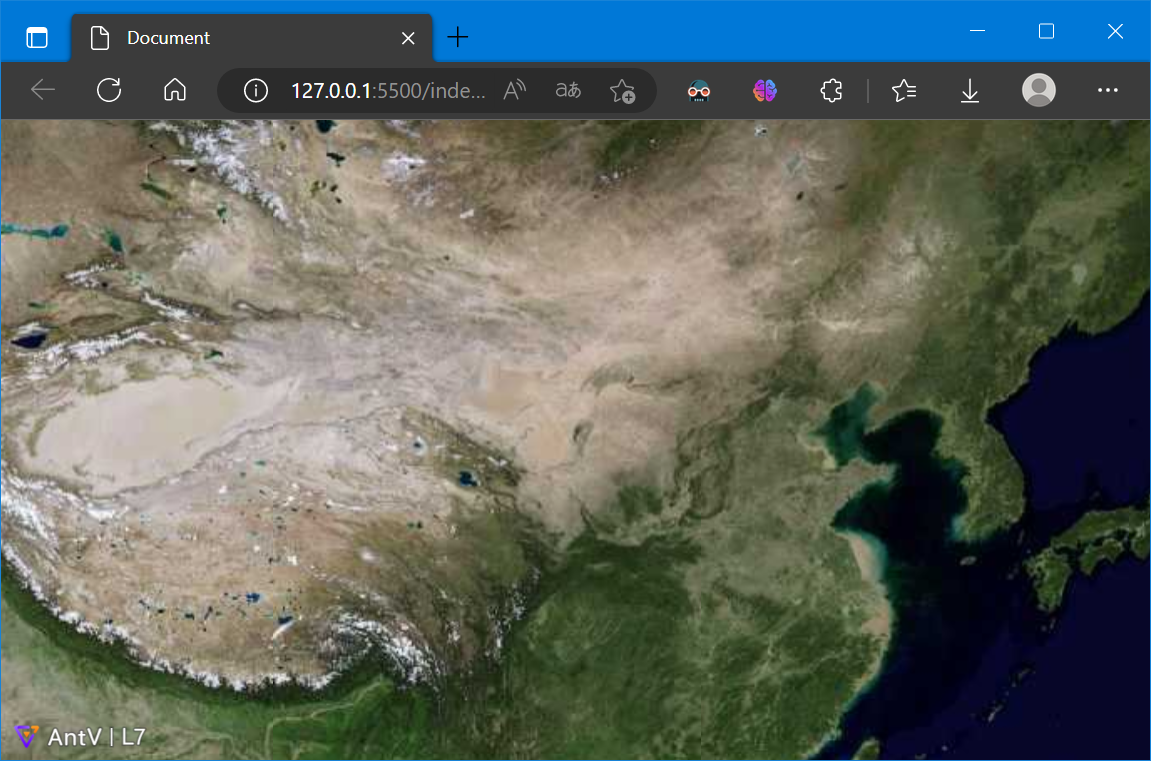
通常,使用栅格瓦片作为底图,L7 的栅格图层支持加载 TMS、WMS、WMTS 等多种格式的图片瓦片
<!DOCTYPE html>
<html lang="en">

<head>
  <meta charset="UTF-8">
  <meta http-equiv="X-UA-Compatible" content="IE=edge">
  <meta name="viewport" content="width=device-width, initial-scale=1.0">
  <title>Document</title>
  <script src='https://unpkg.com/@antv/l7'></script>
  <style>
    body,
    #map {
      height: 100vh;
      width: 100vw;
      margin: 0;
    }
  </style>
</head>

<body>
  <div id="map"></div>
  <script>
    const scene = new L7.Scene({
      id: 'map',
      map: new L7.Map({
        center: [110.770672, 34.159869],
        zoom: 4
      }),
    });

    const url1 =
      'https://t0.tianditu.gov.cn/img_w/wmts?tk=b72aa81ac2b3cae941d1eb213499e15e&';
    const layer1 = new L7.RasterLayer({
      zIndex: 1,
    }).source(url1, {
      parser: {
        type: 'rasterTile',
        tileSize: 256,
        wmtsOptions: {
          layer: 'img',
          tileMatrixset: 'w',
          format: 'tiles',
        },
      },
    });

    scene.on('loaded', () => {
      scene.addLayer(layer1);
    });
  </script>
</body>

</html>
- 注意:L7目前只支持 3857 坐标系
结果如下:
3.1.3 加载矢量数据
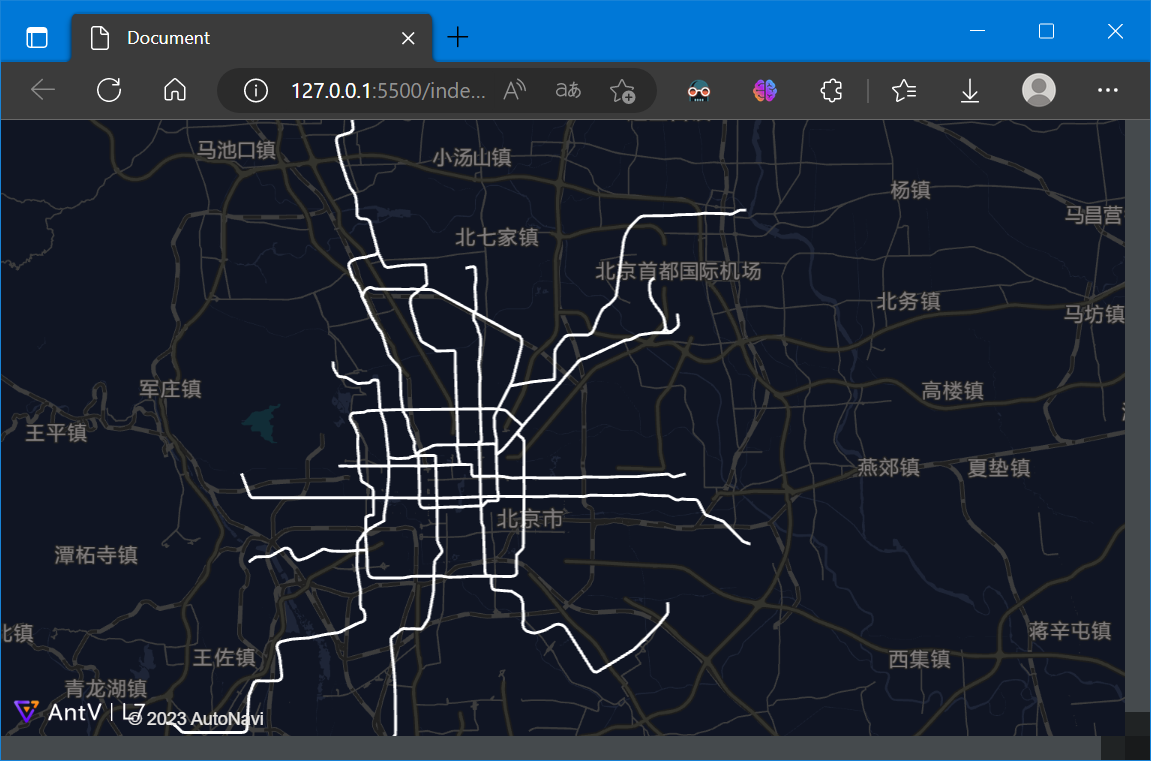
L7支持 GeoJSON数据
<!DOCTYPE html>
<html lang="en">

<head>
  <meta charset="UTF-8">
  <meta http-equiv="X-UA-Compatible" content="IE=edge">
  <meta name="viewport" content="width=device-width, initial-scale=1.0">
  <title>Document</title>
  <script src='https://unpkg.com/@antv/l7'></script>
  <style>
    body,
    #map {
      height: 100vh;
      width: 100vw;
      margin: 0;
    }
  </style>
</head>

<body>
  <div id="map"></div>
  <script>
    const scene = new L7.Scene({
      id: 'map',
      map: new L7.GaodeMap({
        center: [116.3956, 39.9392],
        zoom: 10,
        style: 'dark'
      })
    });
    scene.on('loaded', () => {
      fetch(
        'https://gw.alipayobjects.com/os/basement_prod/0d2f0113-f48b-4db9-8adc-a3937243d5a3.json'
      )
        .then(res => res.json())
        .then(data => {
          const layer = new L7.LineLayer({})
            .source(data)
          scene.addLayer(layer);
        });
    });
  </script>
</body>

</html>
结果如下:
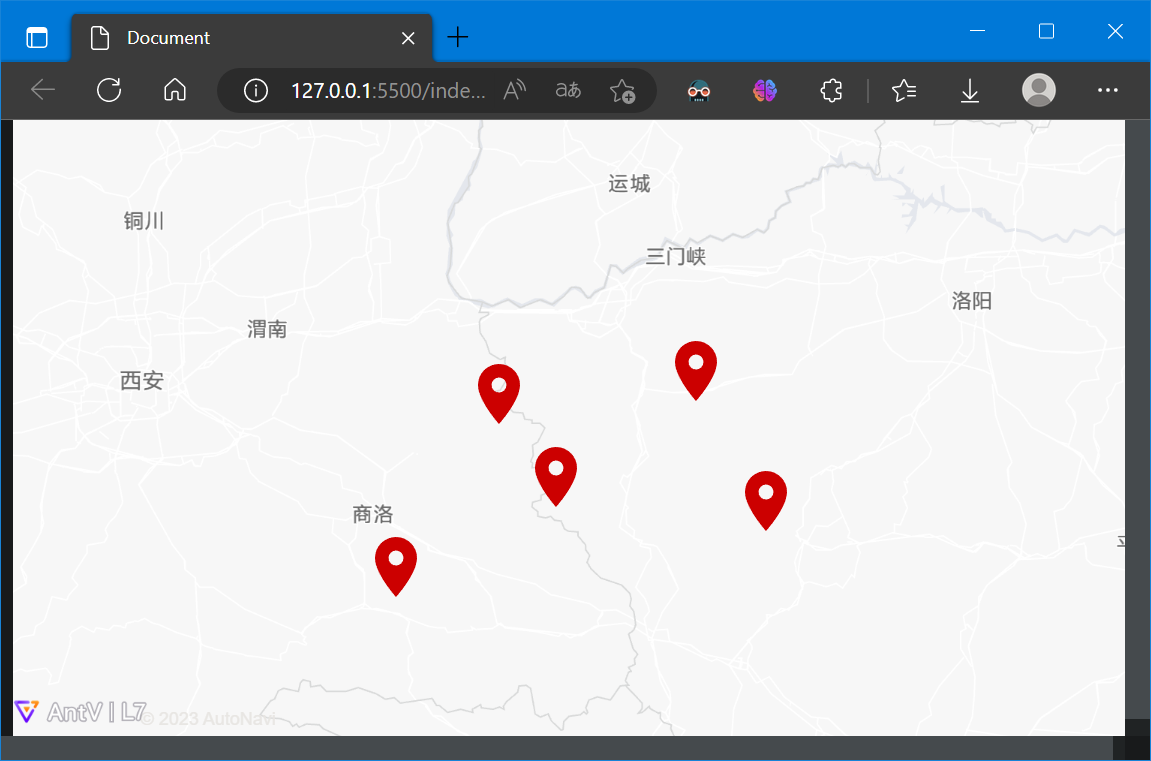
3.1.4 Marker标注
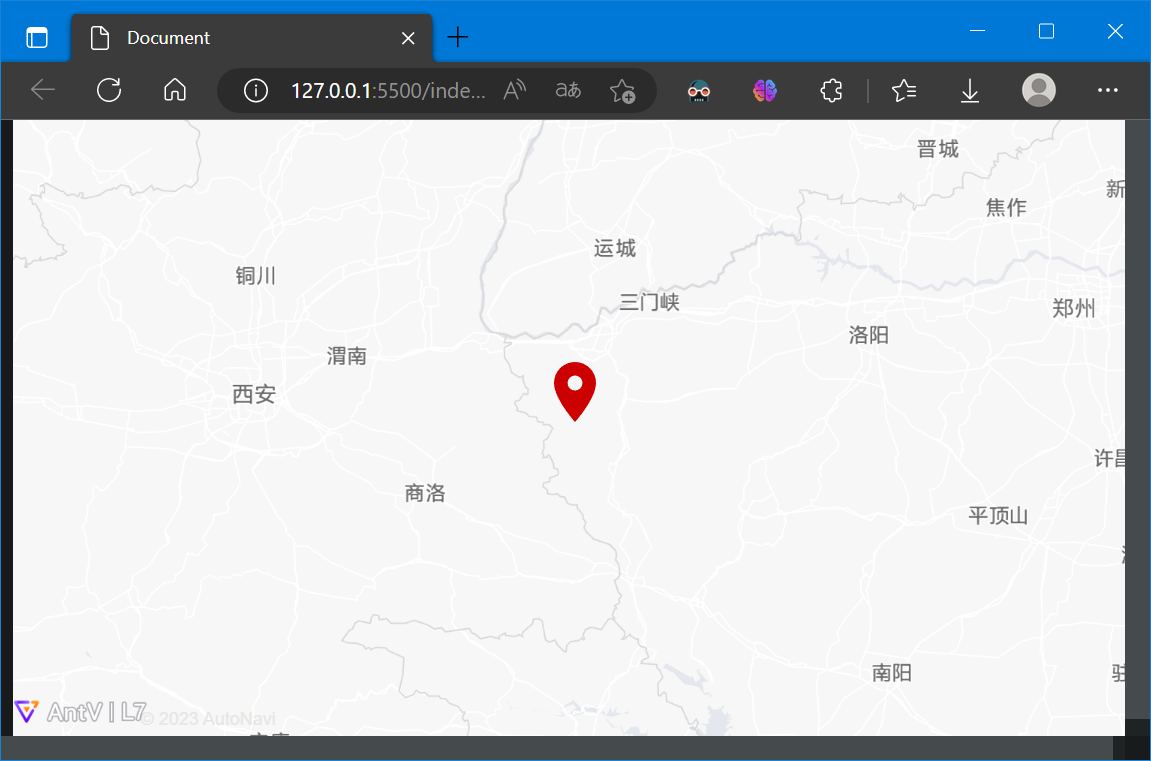
Marker标注是地图上用来标记信息的常用组件
<!DOCTYPE html>
<html lang="en">

<head>
  <meta charset="UTF-8">
  <meta http-equiv="X-UA-Compatible" content="IE=edge">
  <meta name="viewport" content="width=device-width, initial-scale=1.0">
  <title>Document</title>
  <script src='https://unpkg.com/@antv/l7'></script>
</head>

<body>
  <div id="map"></div>
  <script>
    const scene = new L7.Scene({
      id: 'map',
      map: new L7.GaodeMap({
        style: 'light',
        center: [110.770672, 34.159869]
      }),
    });

    const marker = new L7.Marker({
      color: '#f00'
    }).setLnglat([110.770672, 34.159869]);

    scene.addMarker(marker);
  </script>
</body>

</html>
结果如下:
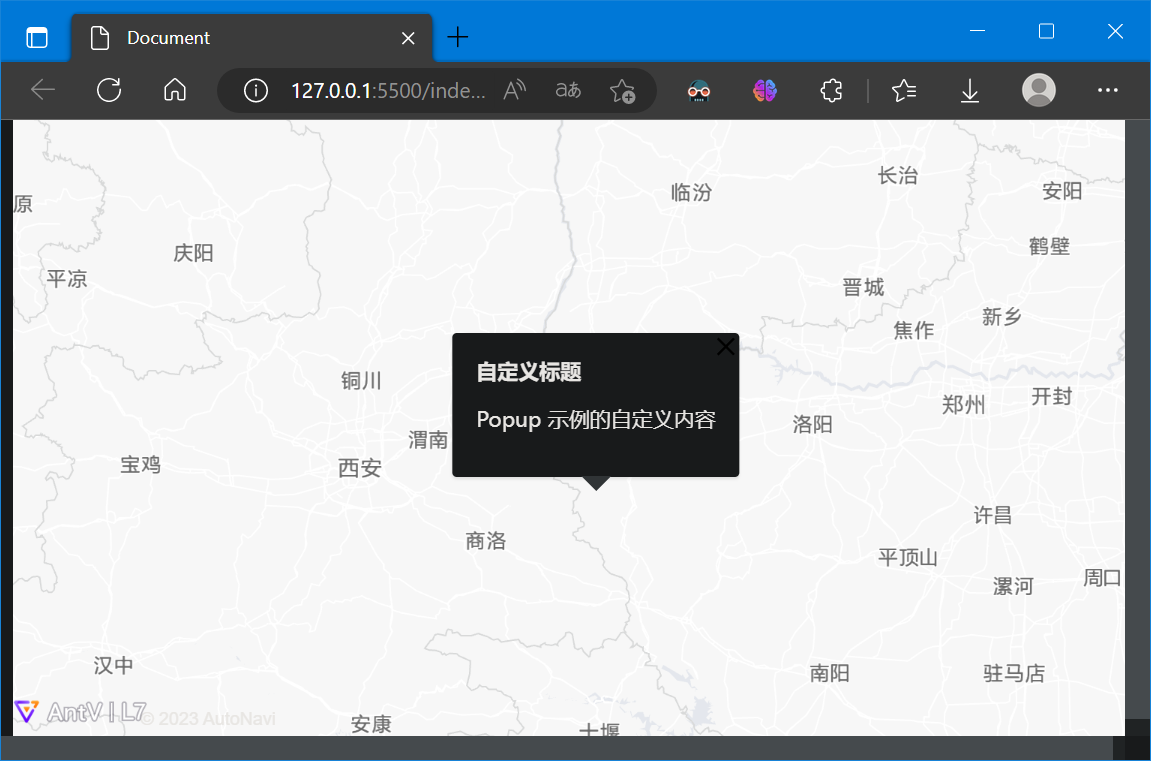
3.1.5 Popup弹窗
Popup弹窗是地图上用来显示信息的常用组件
<!DOCTYPE html>
<html lang="en">

<head>
  <meta charset="UTF-8">
  <meta http-equiv="X-UA-Compatible" content="IE=edge">
  <meta name="viewport" content="width=device-width, initial-scale=1.0">
  <title>Document</title>
  <script src='https://unpkg.com/@antv/l7'></script>
</head>

<body>
  <div id="map"></div>
  <script>
    const scene = new L7.Scene({
      id: 'map',
      map: new L7.GaodeMap({
        style: 'light',
        center: [110.770672, 34.159869]
      }),
    });

    const popup = new L7.Popup({
      title: '自定义标题',
      html: '<p>Popup 示例的自定义内容</p>',
      lngLat: {
        lng: 110.770672,
        lat: 34.159869,
      },
    });

    scene.addPopup(popup);
  </script>
</body>

</html>
结果如下:
3.1.6 事件监听
L7支持事件鼠标点击、双击等事件监听
<!DOCTYPE html>
<html lang="en">

<head>
  <meta charset="UTF-8">
  <meta http-equiv="X-UA-Compatible" content="IE=edge">
  <meta name="viewport" content="width=device-width, initial-scale=1.0">
  <title>Document</title>
  <script src='https://unpkg.com/@antv/l7'></script>
</head>

<body>
  <div id="map"></div>
  <script>
    const scene = new L7.Scene({
      id: 'map',
      map: new L7.GaodeMap({
        style: 'light',
        center: [110.770672, 34.159869]
      }),
    });

    setTimeout(() => {
      scene.on('click', (e) => {
        console.log(e) // 鼠标左键点击事件
        const marker = new L7.Marker({
          color: '#f00'
        }).setLnglat([e.lnglat.lng, e.lnglat.lat]);
        scene.addMarker(marker);
      });
    }, 1000);
    // scene.on('click', (e) => {console.log(e)}); // 直接监听click事件会报错

  </script>
</body>

</html>
结果如下:
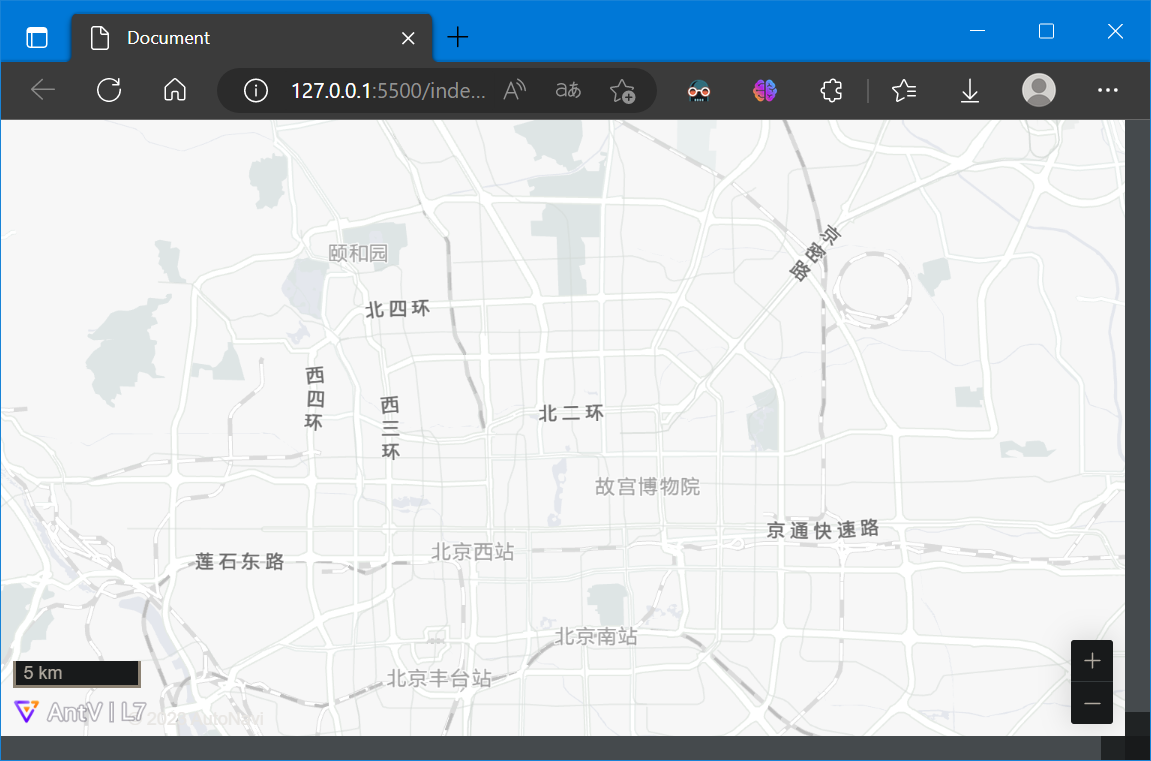
3.1.7 地图控件
在使用地图时,常常需要使用缩放、比例尺等控件
<!DOCTYPE html>
<html lang="en">

<head>
  <meta charset="UTF-8">
  <meta http-equiv="X-UA-Compatible" content="IE=edge">
  <meta name="viewport" content="width=device-width, initial-scale=1.0">
  <title>Document</title>
  <script src='https://unpkg.com/@antv/l7'></script>
  <style>
    body,
    #map {
      height: 100vh;
      width: 100vw;
      margin: 0;
    }
  </style>
</head>

<body>
  <div id="map"></div>
  <script>
    const scene = new L7.Scene({
      id: 'map',
      map: new L7.GaodeMap({
        center: [116.3956, 39.9392],
        zoom: 10,
        style: 'light'
      })
    });

    scene.on('loaded', () => {
      const zoom = new L7.Zoom();
      scene.addControl(zoom);
      const scale = new L7.Scale();
      scene.addControl(scale);
    });

  </script>
</body>

</html>
结果如下:
3.1.8 基础功能小结
综上基础功能案例,不难发现L7满足GIS前端库的基本要求,和经典的GIS前端库(如,Leaflet等)相比,还具有开箱即用、API友好、绘制效果好等优势
3.2 整体架构
L7的整体架构大致总结如下:
4. 使用前端框架
Vue是常用的前端框架,TypeScript(简称TS) 是 JavaScript 的超集,可以提高代码的可维护性和可读性
下面记述基于Vite、Vue3和TypeScript搭建L7开发环境并示例
4.1 环境安装
这里使用Vue 官方的项目脚手架工具创建Vue开发环境(其他方式也可,如直接使用Vite创建)
在CMD(或Shell)中,切换到存放代码的目录,并执行:
npm init vue@latest
接着选择一系列创建选项,通常默认即可:
Need to install the following packages:
  create-vue@3.6.4
Ok to proceed? (y) y

Vue.js - The Progressive JavaScript Framework

√ Project name: ... L7Test
√ Package name: ... l7test
√ Add TypeScript? ... No / Yes
√ Add JSX Support? ... No / Yes
√ Add Vue Router for Single Page Application development? ... No / Yes
√ Add Pinia for state management? ... No / Yes
√ Add Vitest for Unit Testing? ... No / Yes
√ Add an End-to-End Testing Solution? ? No
√ Add ESLint for code quality? ... No / Yes

Scaffolding project in E:\Code\test\L7Test...

Done. Now run:

  cd L7Test
  npm install
  npm run dev
然后根据提示依次执行命令:
cd L7Test
npm install
npm run dev
一个Vue模板就搭建完成:
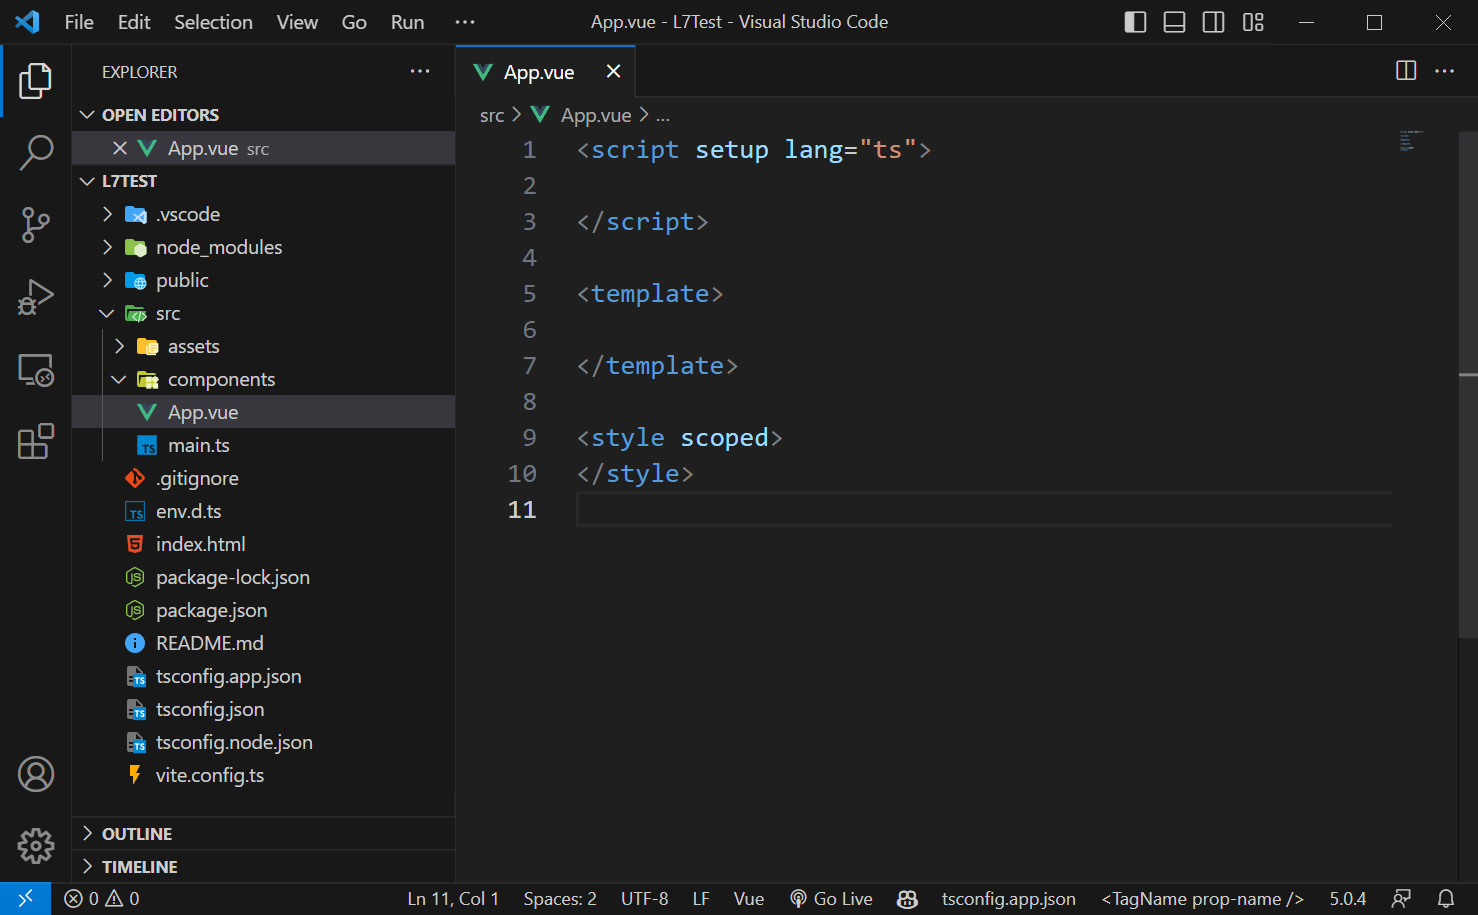
使用VS Code(其他也可)打开刚刚创建的项目,删除掉src/components下的默认文件,并清除App.vue的默认内容:
在Terminal(CMD或Shell也可)中安装L7:
npm install @antv/l7
在App.vue中编写代码加载L7地图:
<script setup lang="ts">
import { Scene } from "@antv/l7";
import { GaodeMap } from "@antv/l7-maps";

const scene = new Scene({
  id: "map",
  map: new GaodeMap({
    center: [120.19382669582967, 30.258134],
    pitch: 0,
    style: "dark",
    zoom: 10,
  }),
});
</script>

<template>
  <div id="map"></div>
</template>

<style scoped>
#map {
  height: 100%;
  width: 100%;
}
</style>
- 注:L7使用TS编写,使用TS有良好的代码提示和检测功能
结果如下:
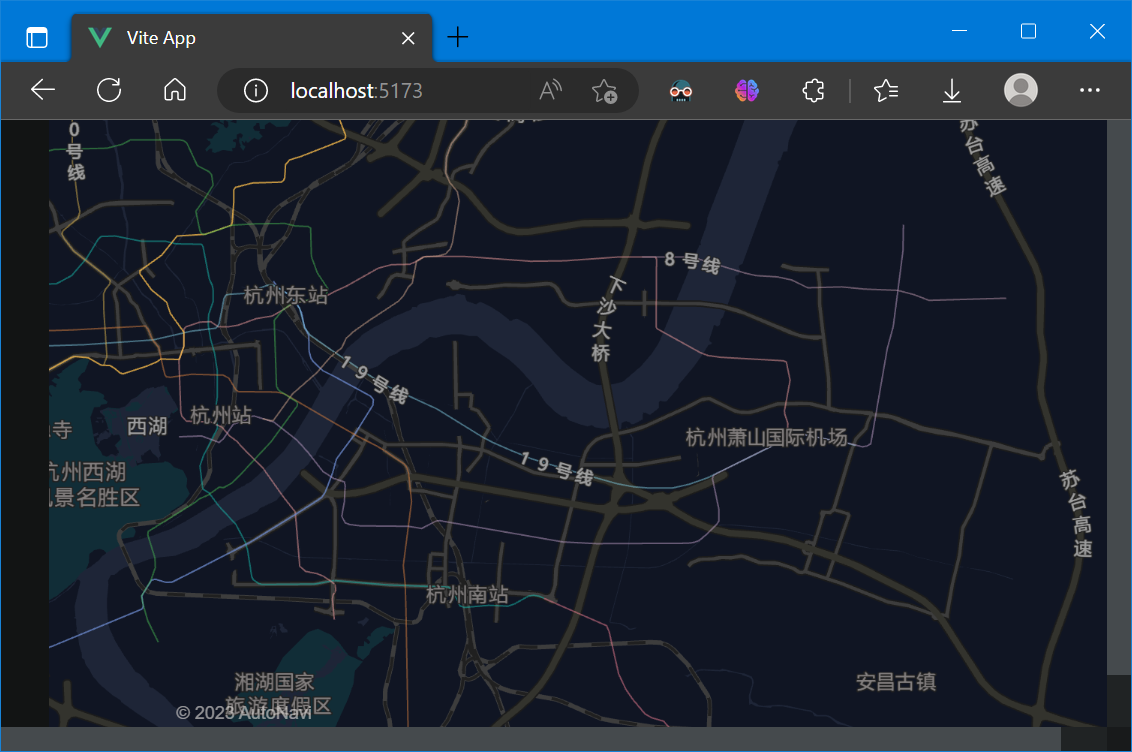
至此环境安装完成
4.2 示例
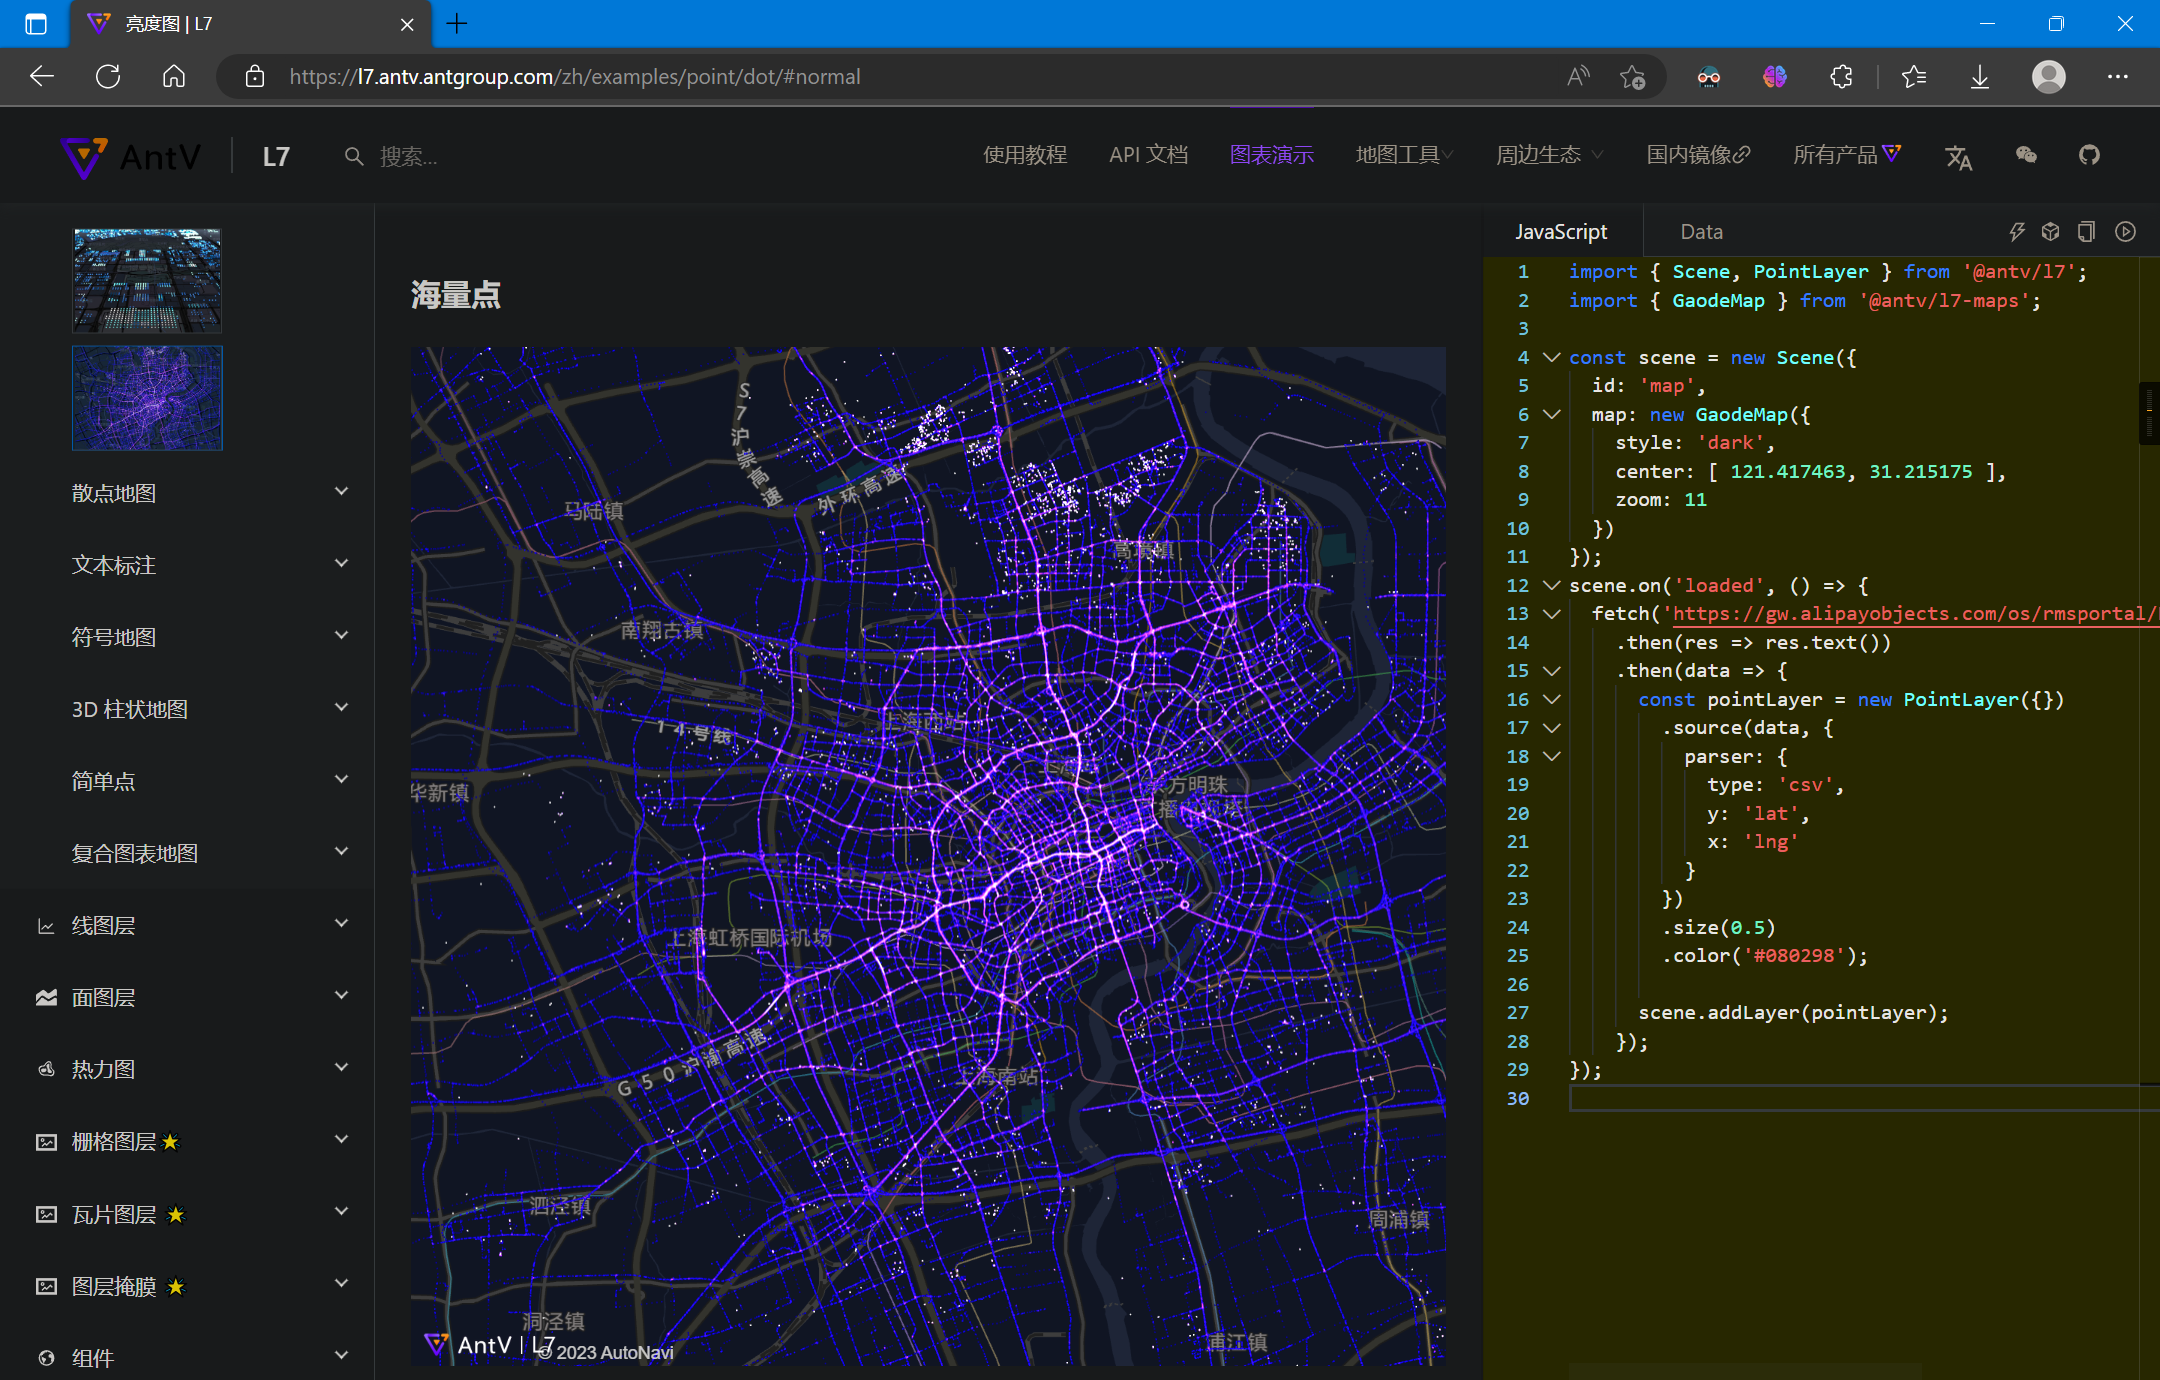
官方示例:所有图表 | L7 (antgroup.com),基本演示了绝大部分的图表,并且示例代码和上述App.vue中的script标签下差不多,可以直接复制使用,如下图所示:
直接将示例中的代码复制到App.vue的script中即可运行:
<script setup lang="ts">
import { Scene, PointLayer } from '@antv/l7';
import { GaodeMap } from '@antv/l7-maps';

const scene = new Scene({
  id: 'map',
  map: new GaodeMap({
    style: 'dark',
    center: [ 121.417463, 31.215175 ],
    zoom: 11
  })
});
scene.on('loaded', () => {
  fetch('https://gw.alipayobjects.com/os/rmsportal/BElVQFEFvpAKzddxFZxJ.txt')
    .then(res => res.text())
    .then(data => {
      const pointLayer = new PointLayer({})
        .source(data, {
          parser: {
            type: 'csv',
            y: 'lat',
            x: 'lng'
          }
        })
        .size(0.5)
        .color('#080298');

      scene.addLayer(pointLayer);
    });
});
</script>

<template>
  <div id="map"></div>
</template>

<style scoped>
#map {
  height: 100%;
  width: 100%;
}
</style>
结果如下:
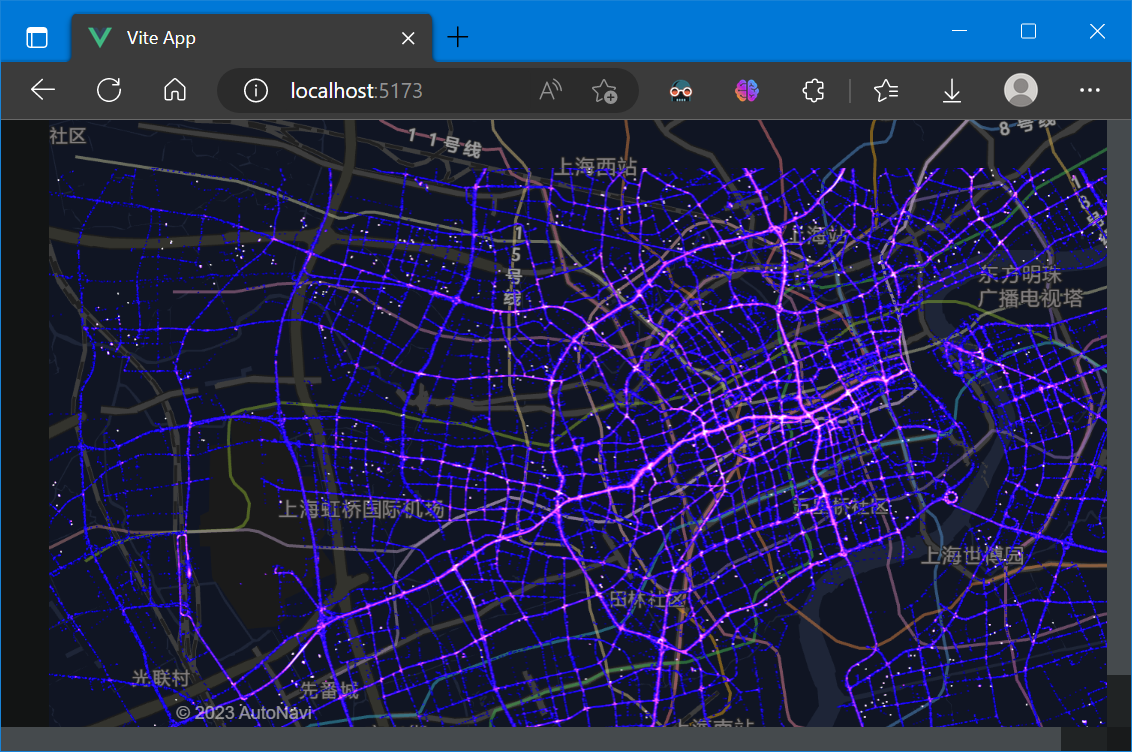
具体函数API的使用,可以查阅API手册:场景 Scene | L7 (antgroup.com)
官网示例图表,均可用上述方式移植到项目中使用
5. 案例练习
5.1 案例一:全球AQI数据获取与L7可视化
下面记述使用L7对全球AQI数据进行可视化
5.1.1 数据获取
全球AQI数据可从这个网站获取:World's Air Pollution: Real-time Air Quality Index (waqi.info)
进入这个网站后打开控制台,刷新网页重新加载,找到000.json
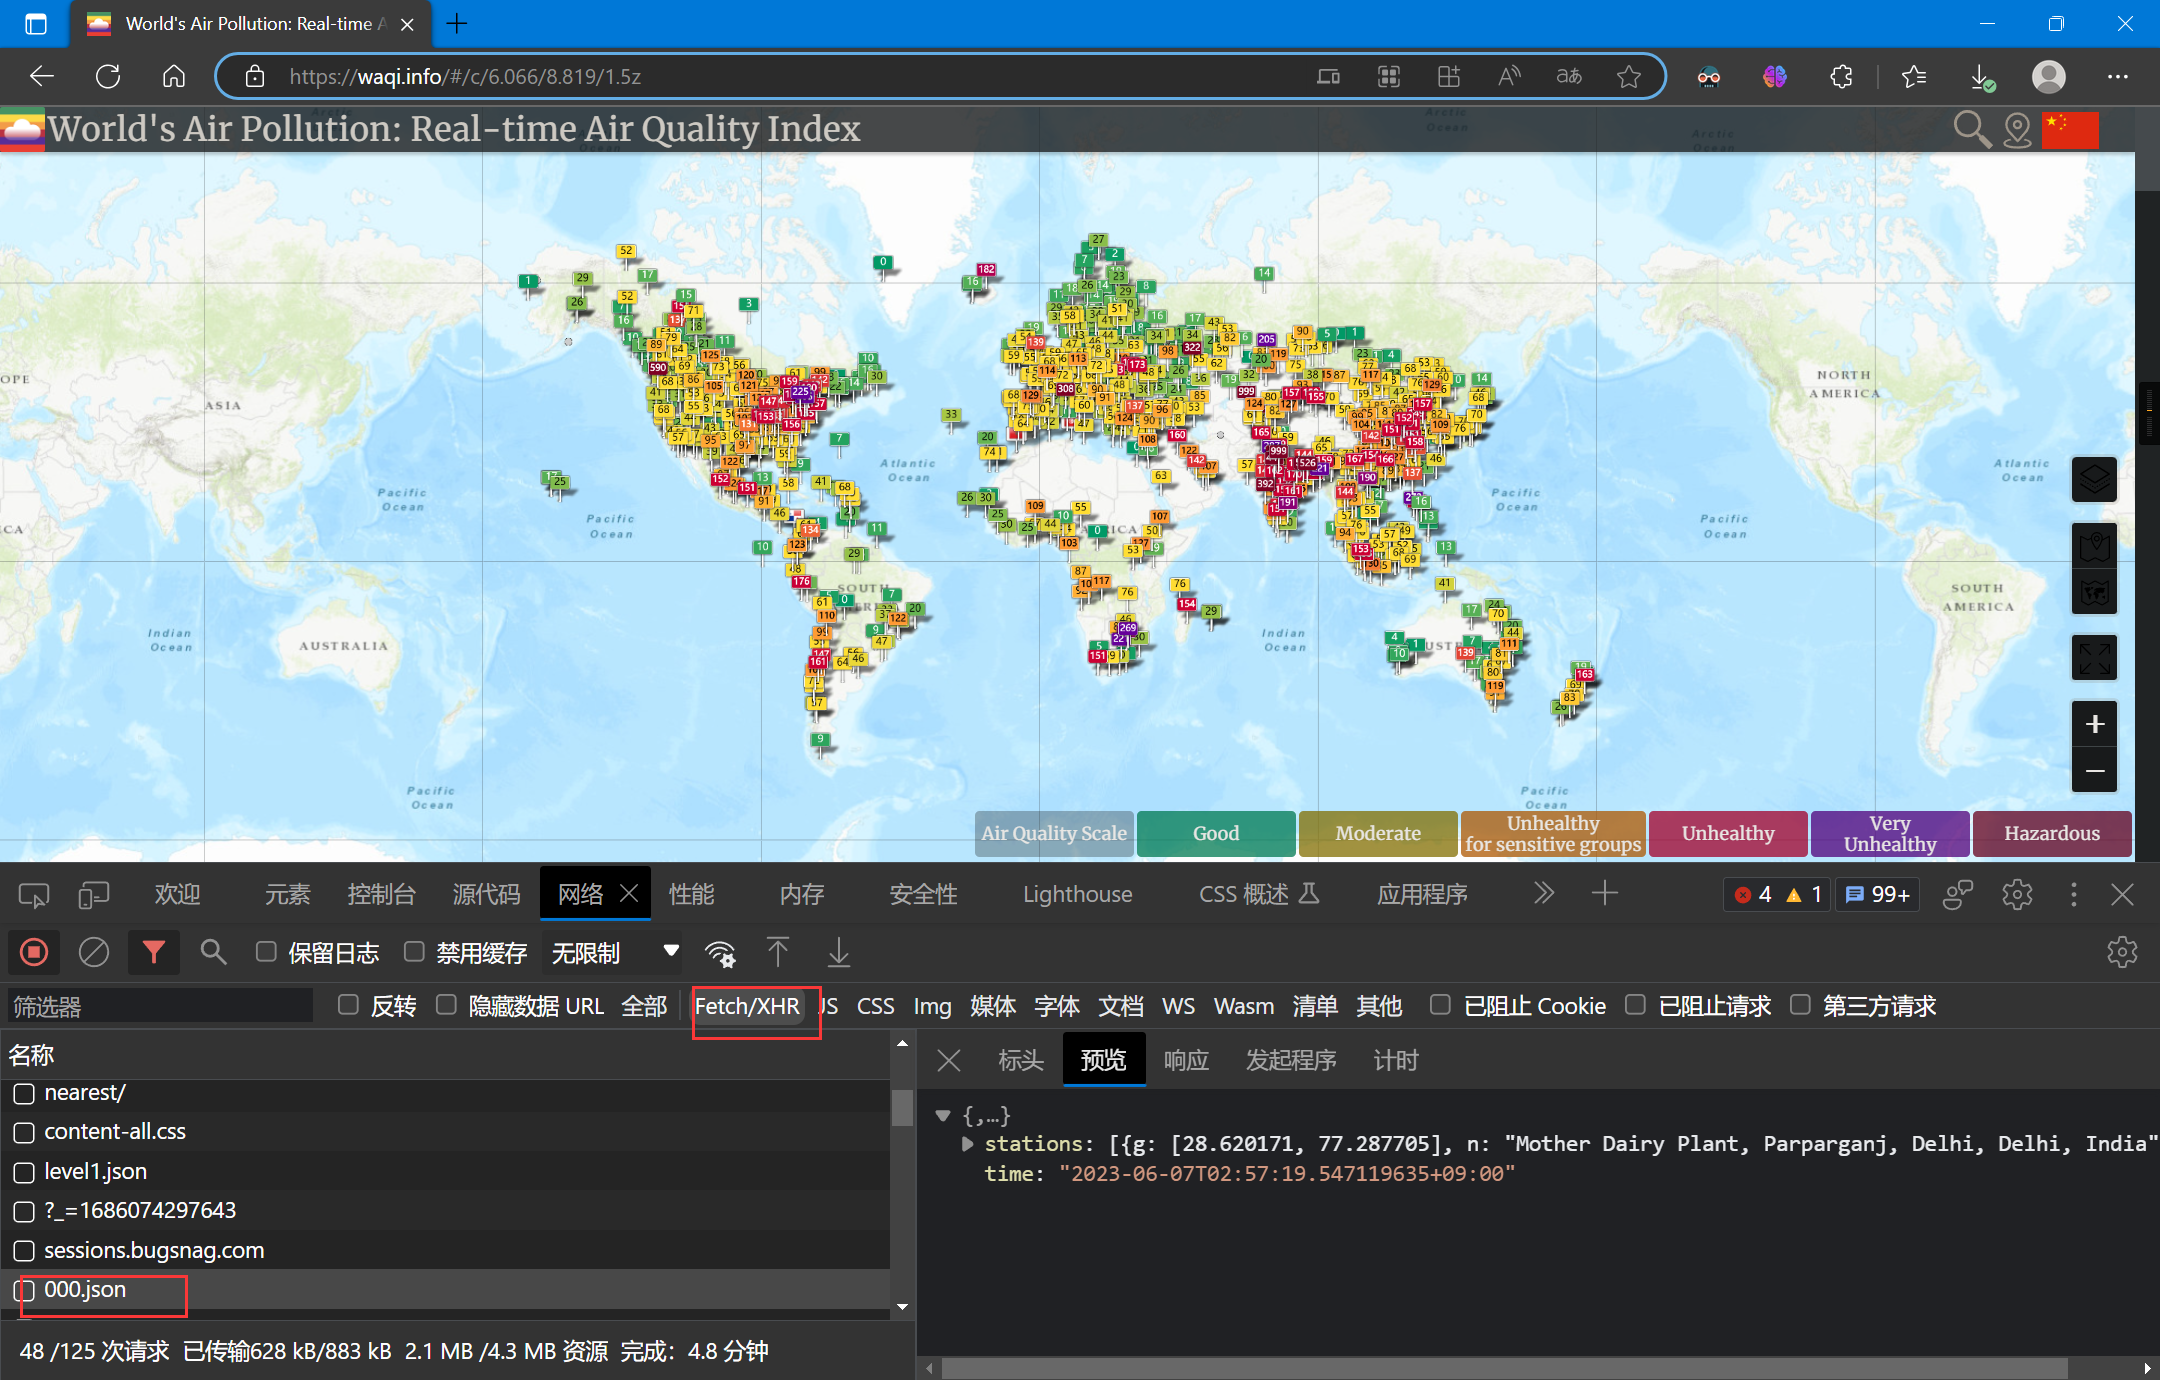
在000.json上右键并在新标签页中打开:
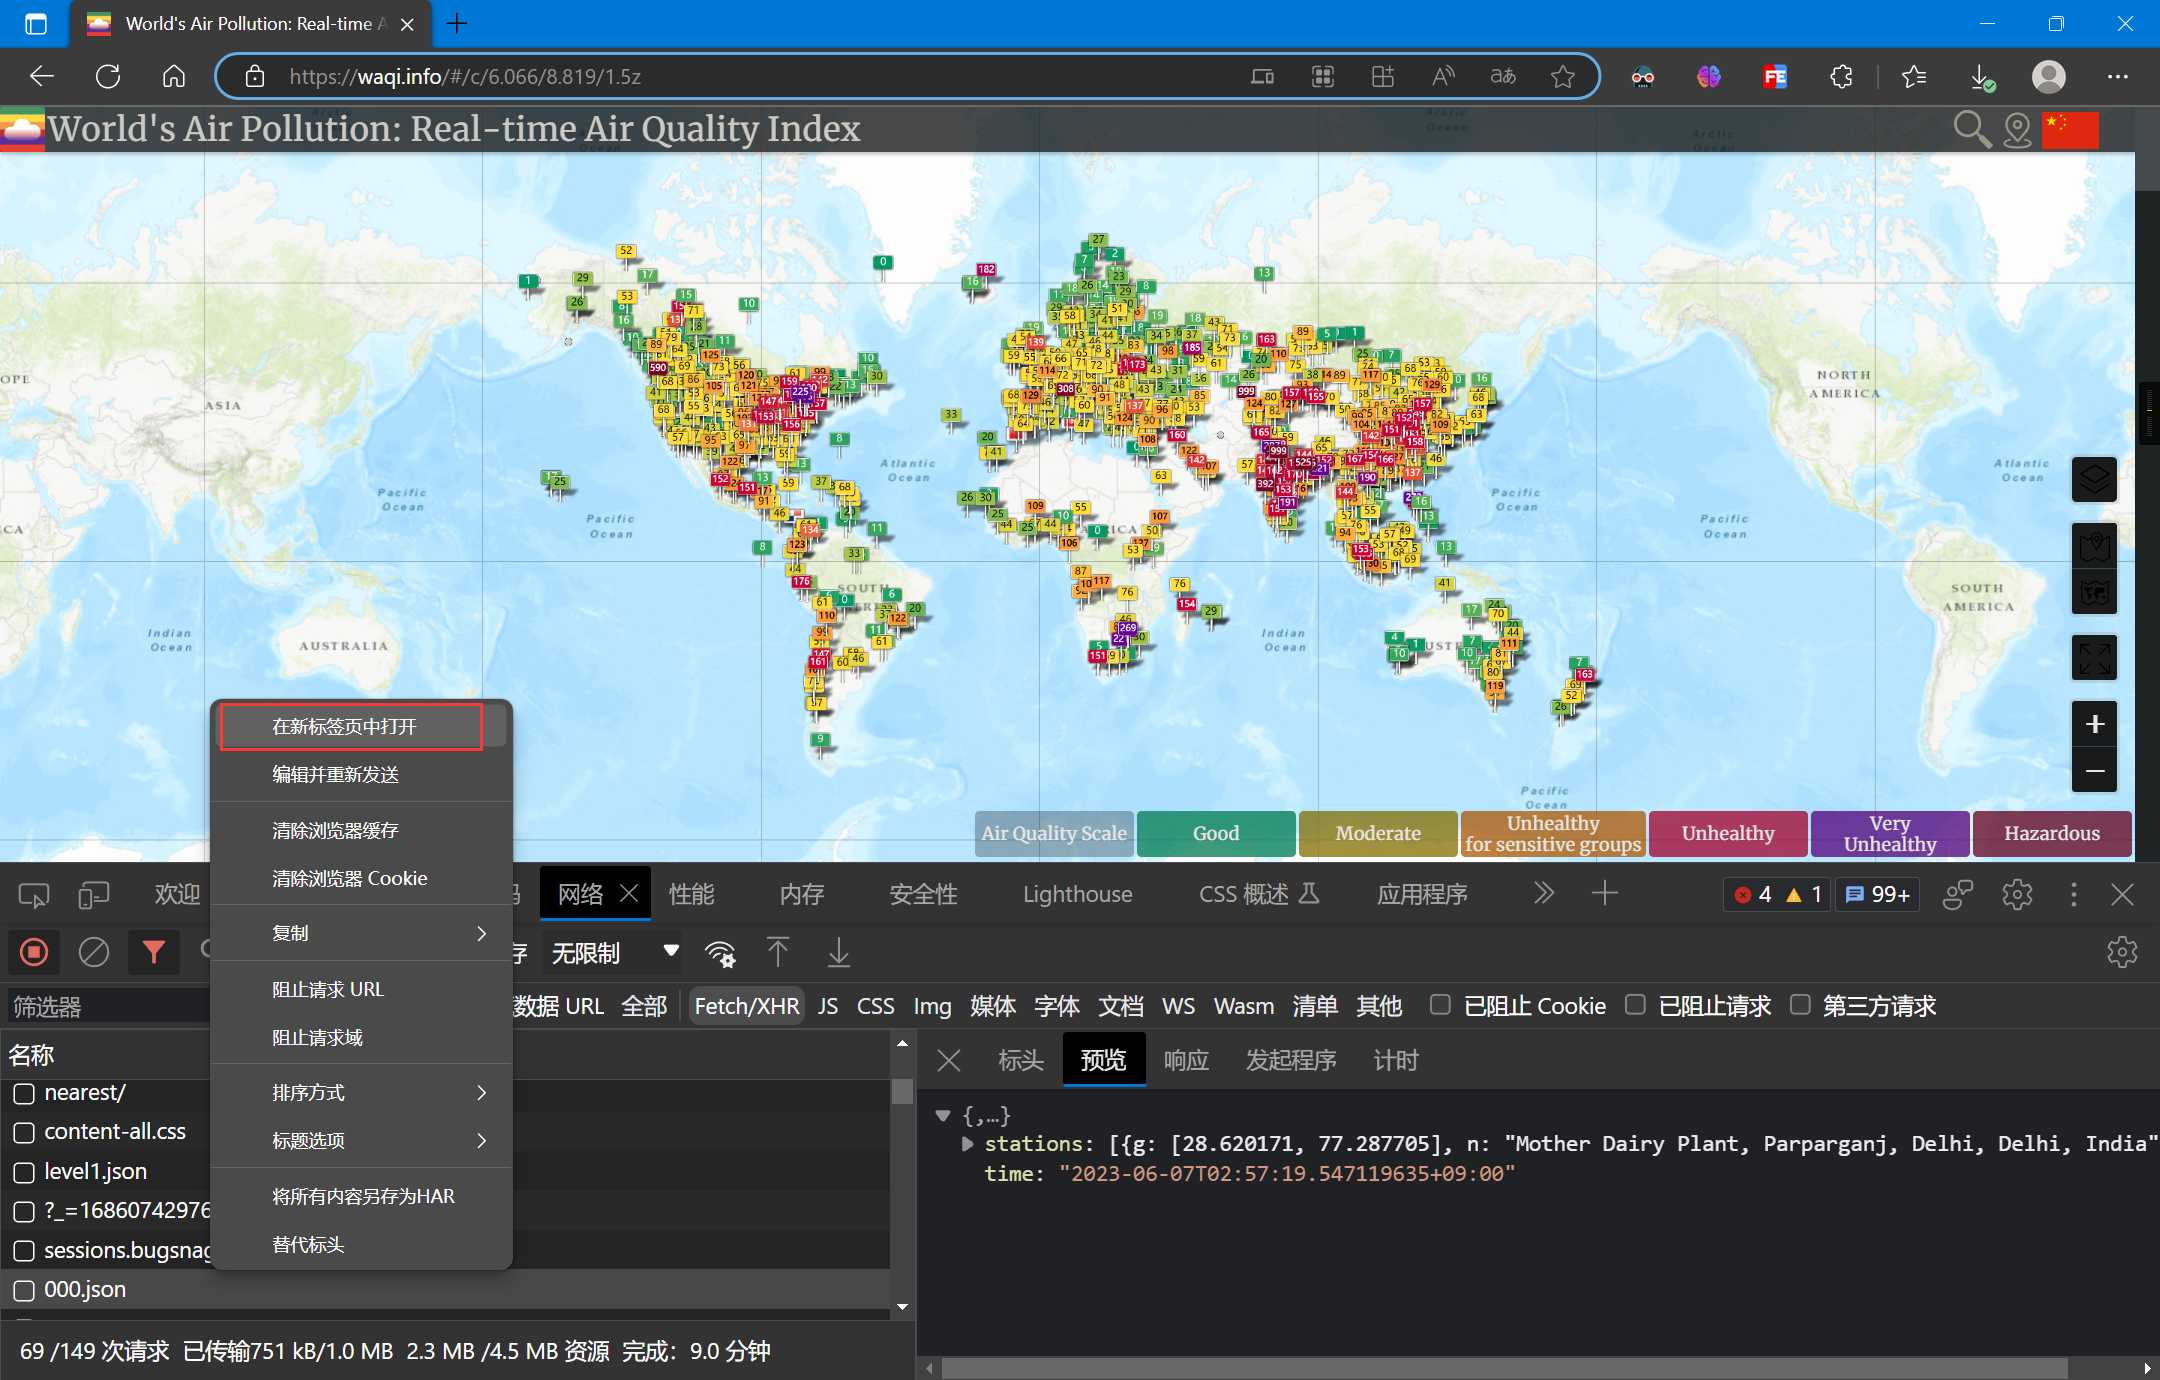
在新标签页中右键并另存为:
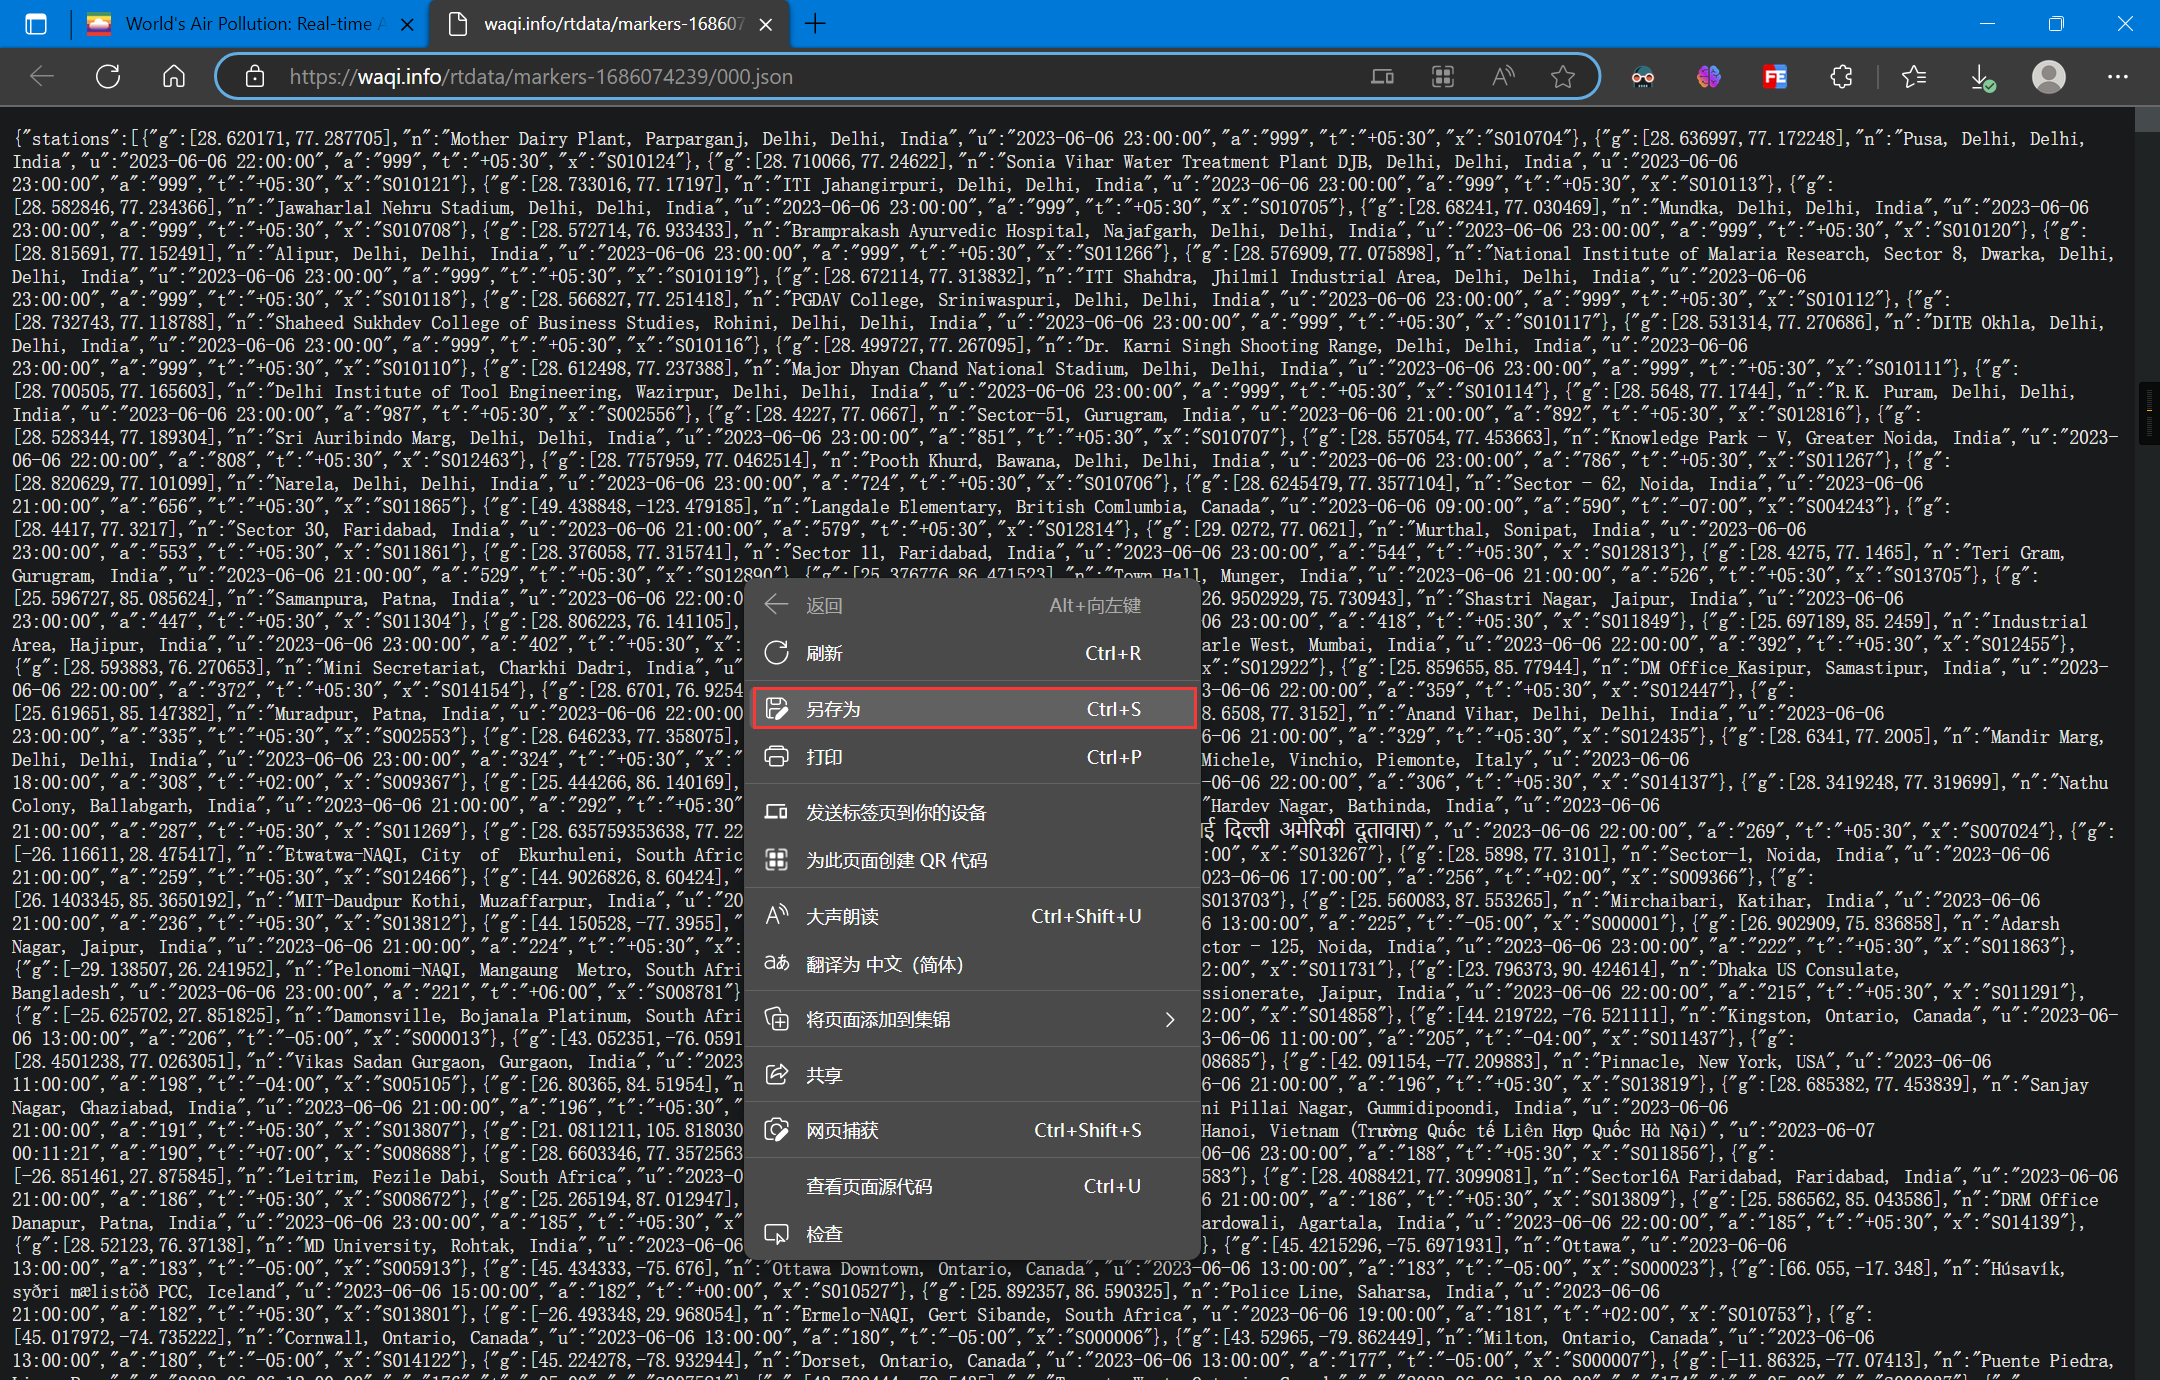
即可获得JSON数据
5.1.2 L7可视化
可参考官方散点图样例:简单点 | L7 (antgroup.com)
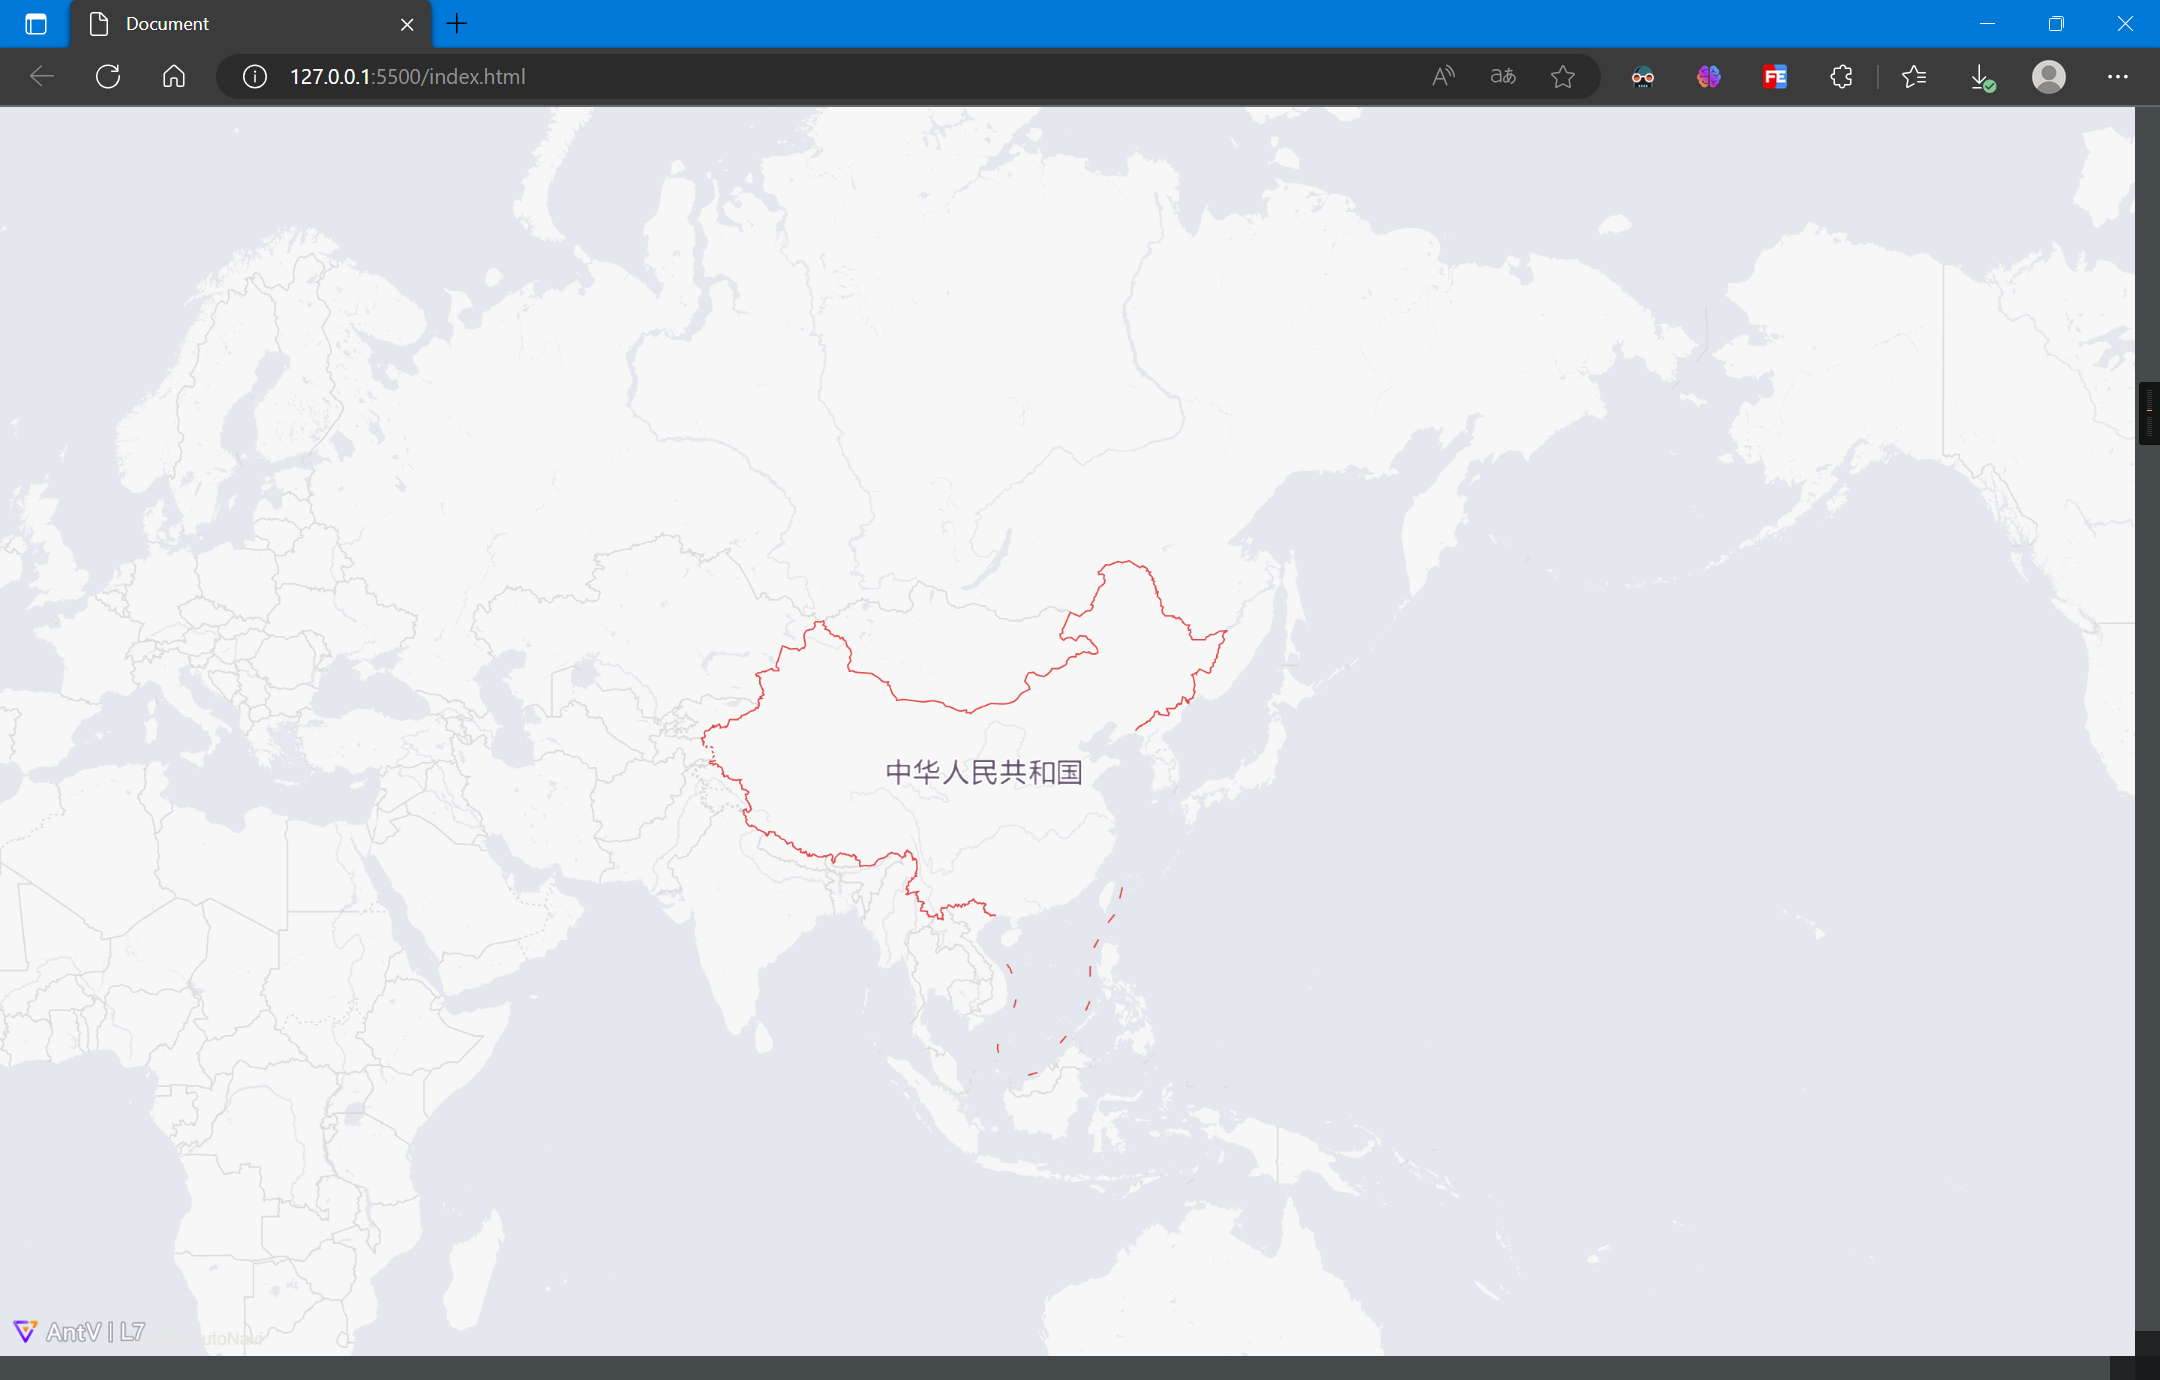
5.1.2.1 加载底图
加载高德地图
<!DOCTYPE html>
<html lang="en">

<head>
  <meta charset="UTF-8">
  <meta http-equiv="X-UA-Compatible" content="IE=edge">
  <meta name="viewport" content="width=device-width, initial-scale=1.0">
  <title>Document</title>
  <script src='https://unpkg.com/@antv/l7'></script>
  <style>
    body,
    #map {
      height: 100vh;
      width: 100vw;
      margin: 0;
    }
  </style>
</head>

<body>
  <div id="map"></div>
  <script>
    const scene = new L7.Scene({
      id: 'map',
      map: new L7.GaodeMap({
        center: [116.3956, 39.9392],
        zoom: 2,
        style: 'light'
      })
    });
  </script>
</body>

</html>
5.1.2.2 加载数据并解析
根据数据内容,将经纬度数组转置以符合L7的数据格式:
scene.on('loaded', () => {
    fetch('./000.json')
        .then(res => res.json())
        .then(data => {
        data = data.stations
        data.forEach(item => {
            item.g.reverse()
        })
        console.log(data);
    })
});
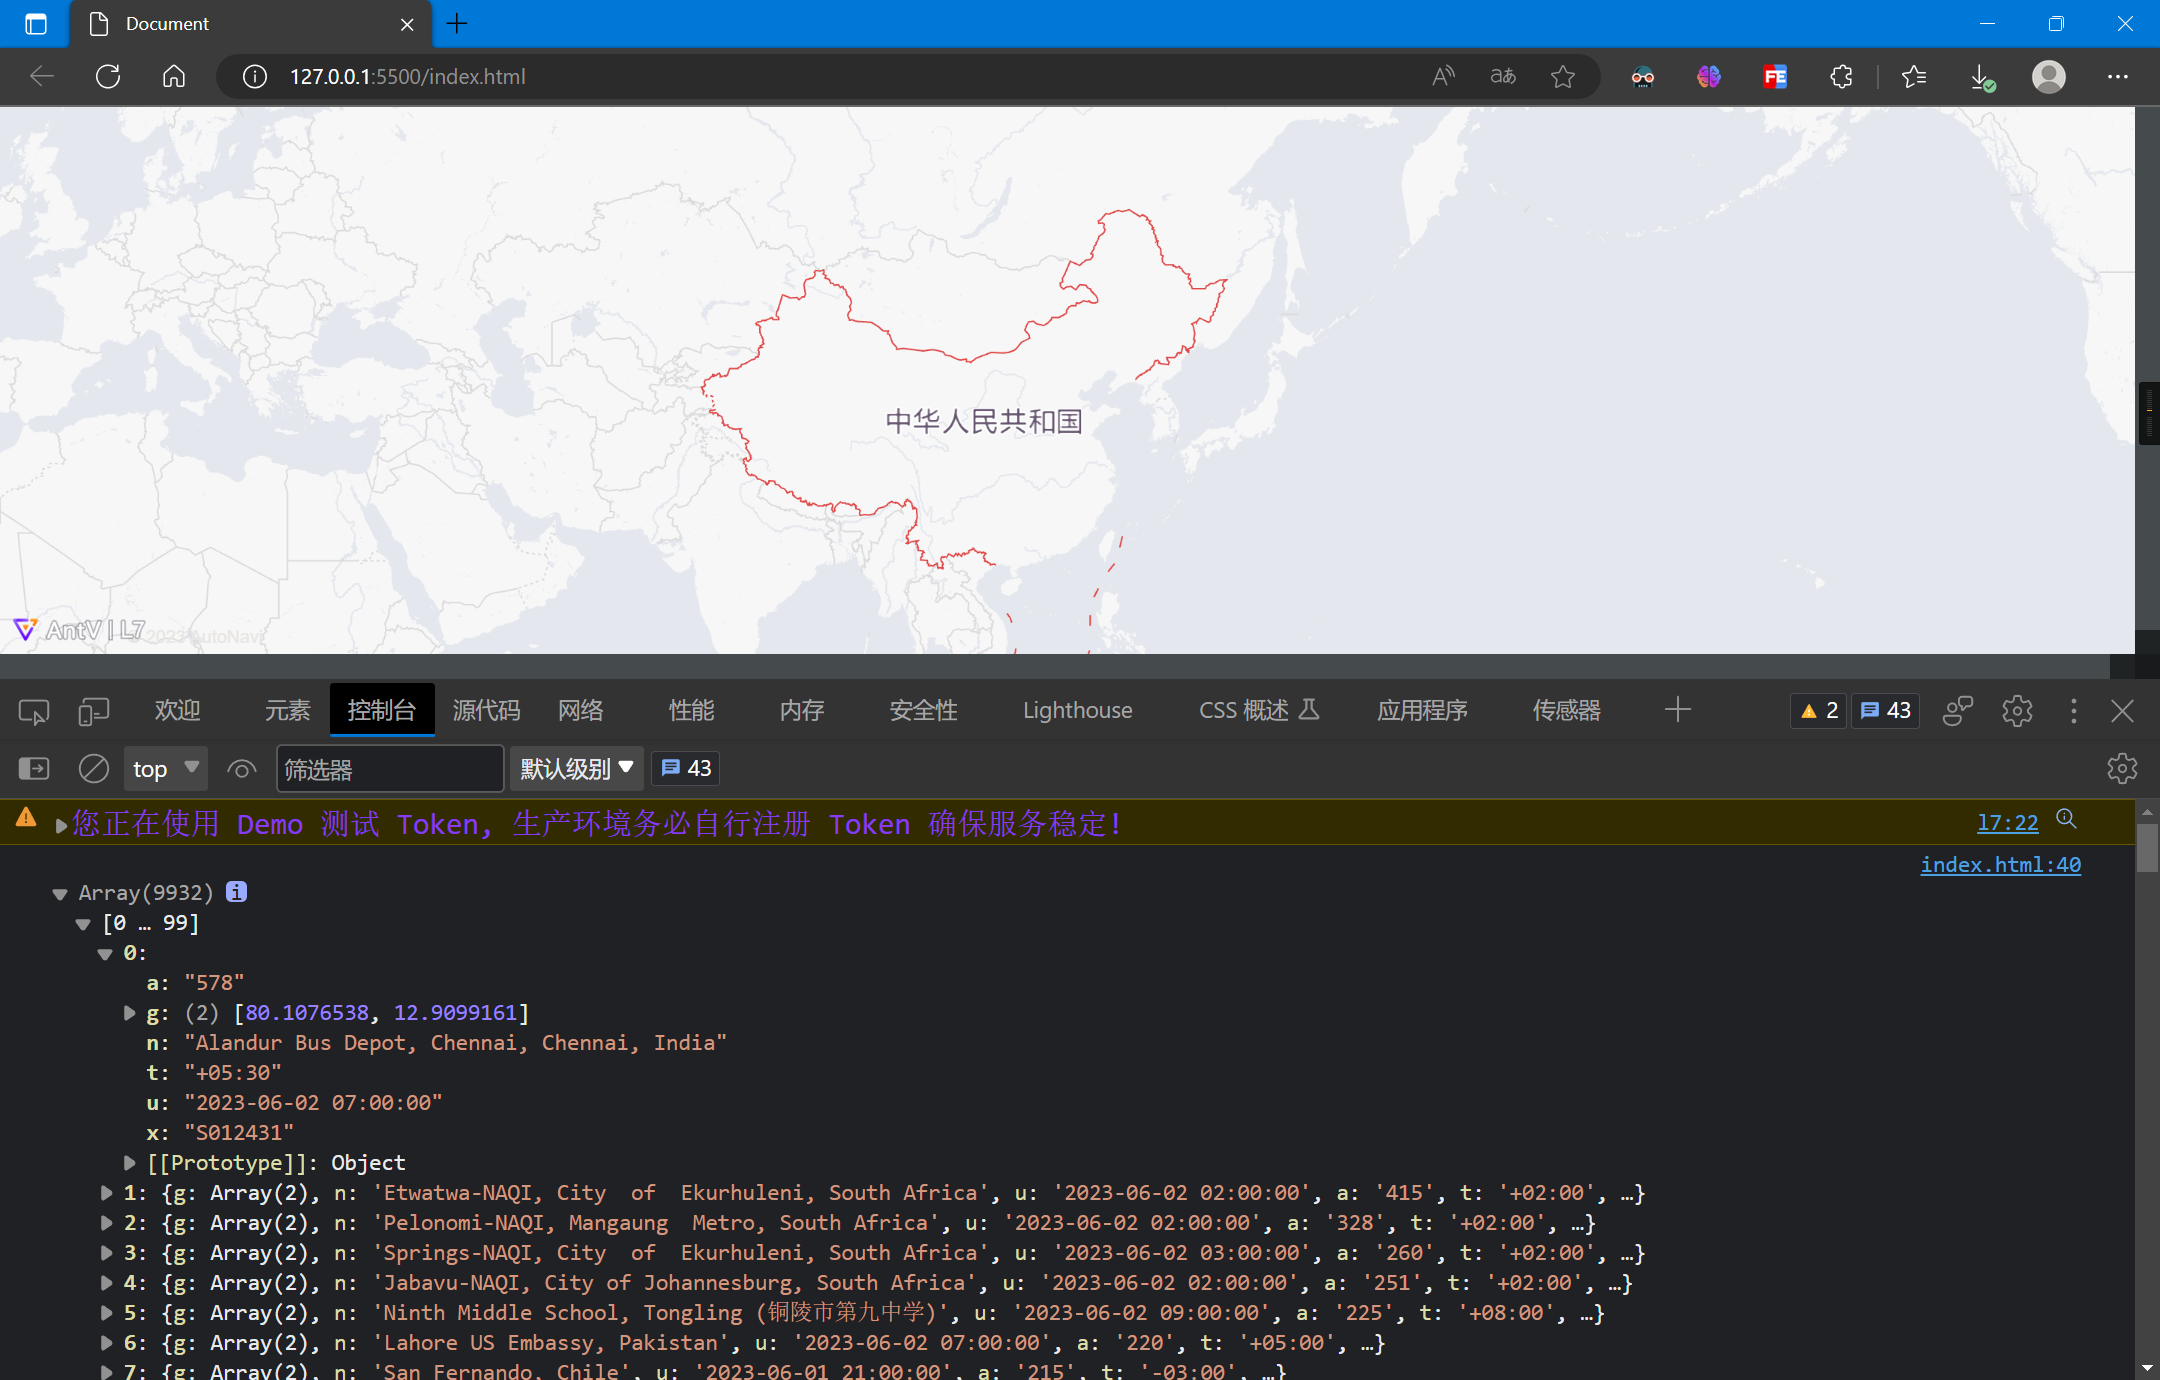
5.1.2.3 绘制样式
绘制点图层,并设置样式:
const layer = new L7.PointLayer()
    .source(data, {
        parser: {
            type: 'json',
            coordinates: 'g'
        }
    })
    .shape('circle')
    .color('a', (value) => {
        // 大于0小于50的绿色
        if (value > 0 && value < 50) {
            return '#00ff00'
        } else if (value > 50 && value < 100) {
            // 大于50小于100的蓝色
            return '#0000ff'
        } else if (value > 100) {
            // 大于100的红色
            return '#ff0000'
        }
    })
    .size('a', (value) => {
        // 根据value值设置点的大小
        let a = value / 100 + 2;
        return a;
    })
    .active(true);
scene.addLayer(layer);
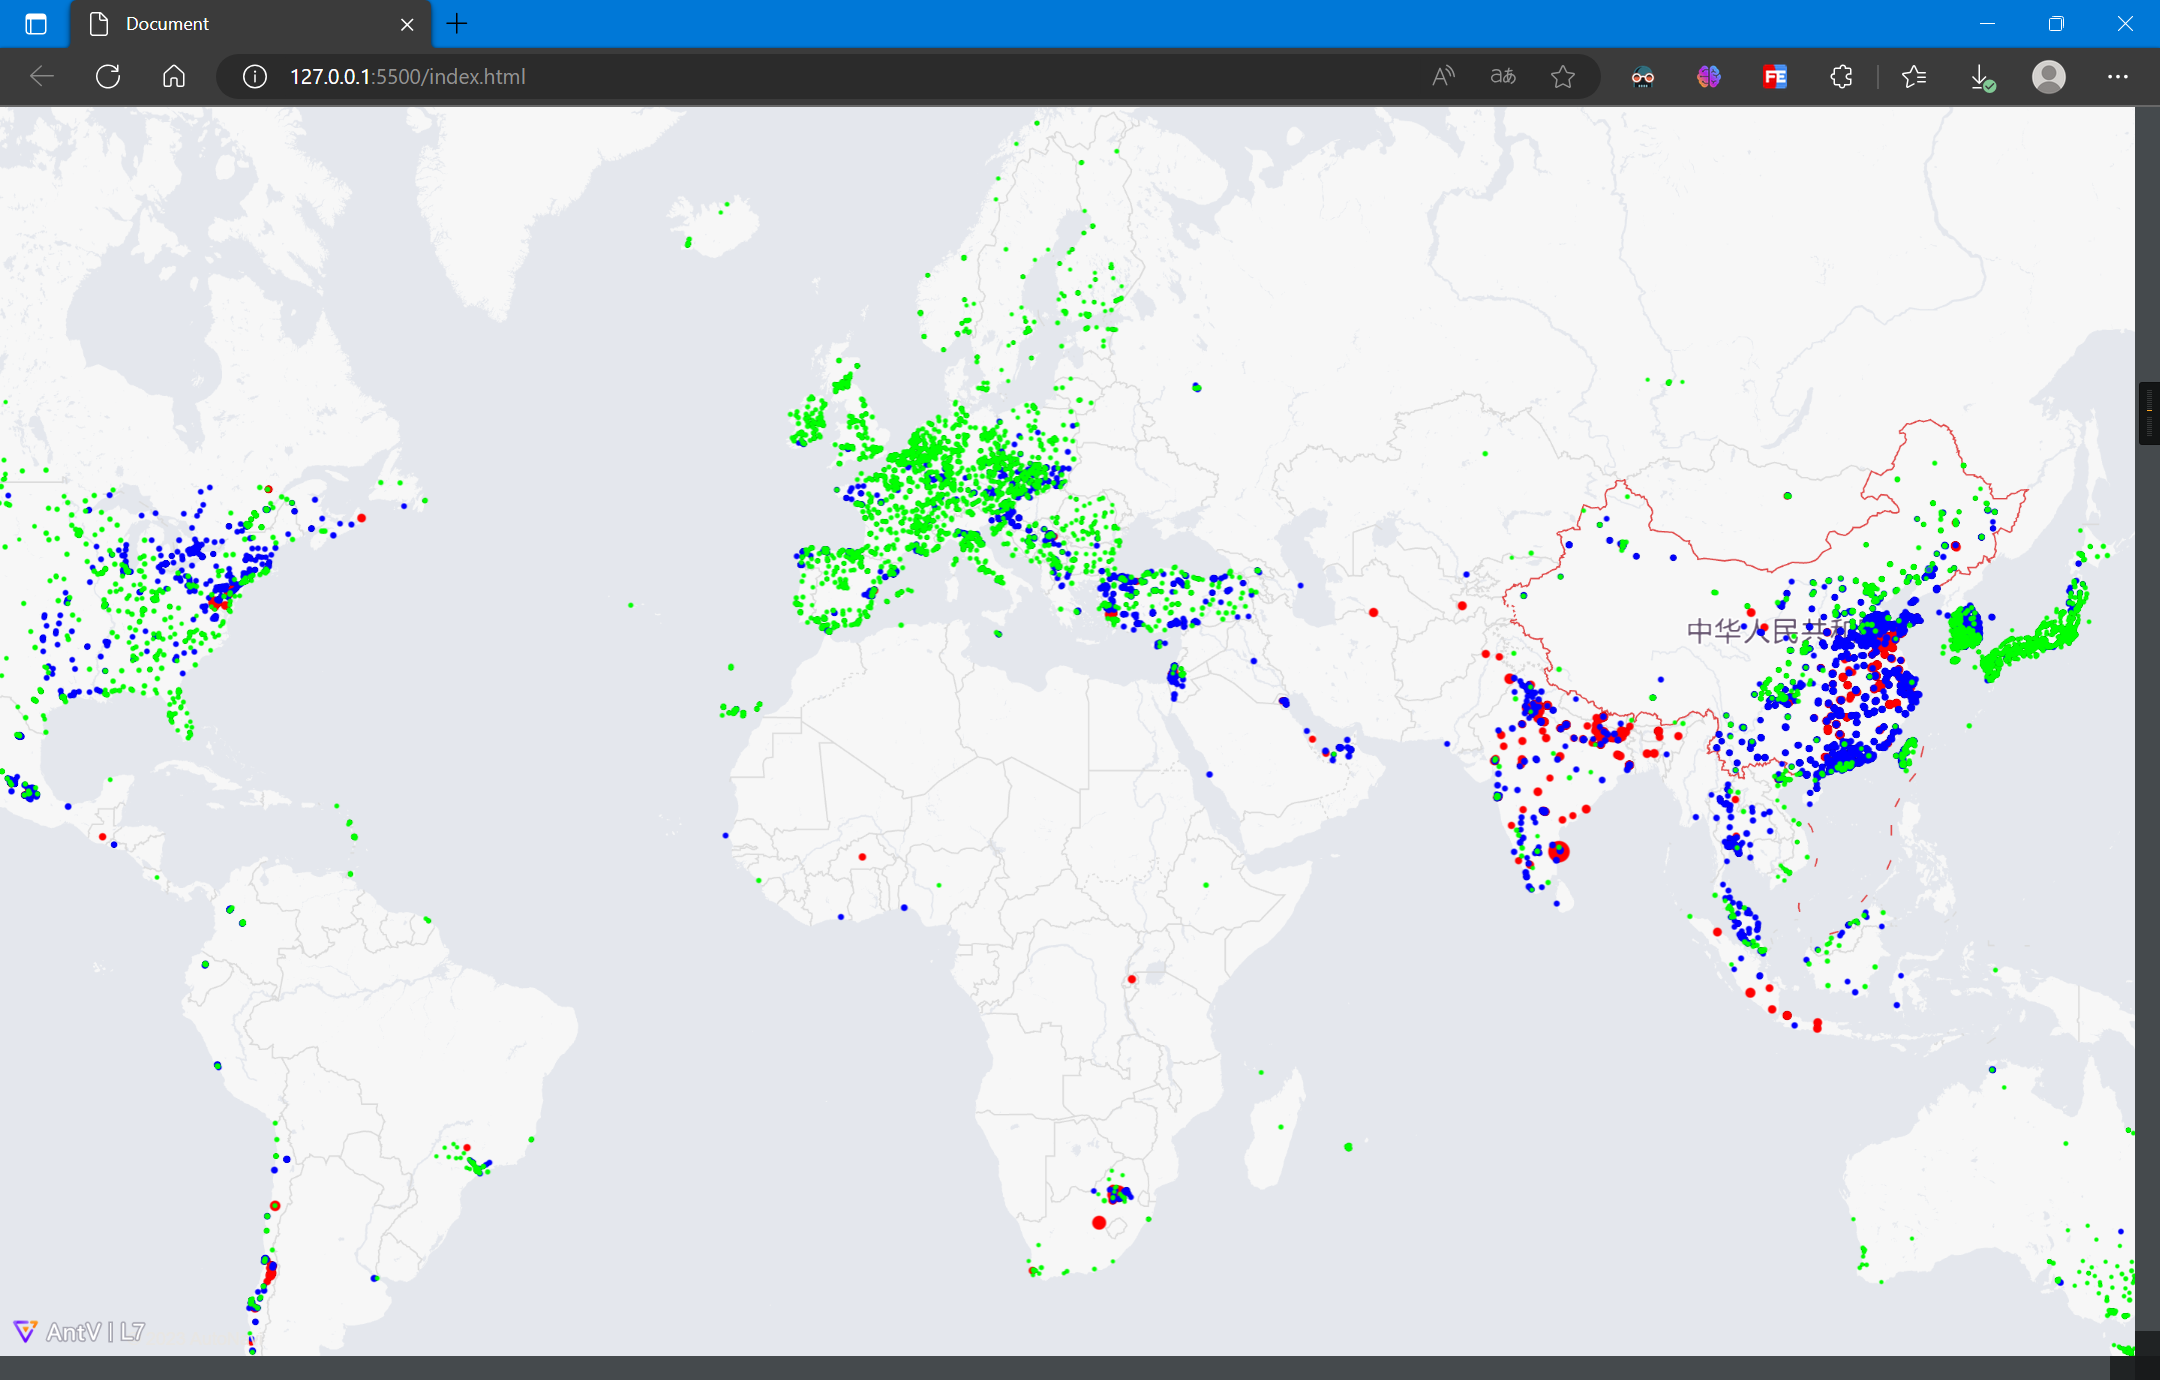
5.1.2.4 完整代码
完整代码如下:
<!DOCTYPE html>
<html lang="en">

<head>
  <meta charset="UTF-8">
  <meta http-equiv="X-UA-Compatible" content="IE=edge">
  <meta name="viewport" content="width=device-width, initial-scale=1.0">
  <title>Document</title>
  <script src='https://unpkg.com/@antv/l7'></script>
  <style>
    body,
    #map {
      height: 100vh;
      width: 100vw;
      margin: 0;
    }
  </style>
</head>

<body>
  <div id="map"></div>
  <script>
    const scene = new L7.Scene({
      id: 'map',
      map: new L7.GaodeMap({
        center: [116.3956, 39.9392],
        zoom: 2,
        style: 'light'
      })
    });

    scene.on('loaded', () => {
      fetch('./000.json')
        .then(res => res.json())
        .then(data => {
          data = data.stations
          data.forEach(item => {
            item.g.reverse()
          })
          // console.log(data);
          const layer = new L7.PointLayer()
            .source(data, {
              parser: {
                type: 'json',
                coordinates: 'g'
              }
            })
            .shape('circle')
            .color('a', (value) => {
                // 大于0小于50的绿色
              if (value > 0 && value < 50) {
                return '#00ff00'
              } else if (value > 50 && value < 100) {
                // 大于50小于100的蓝色
                return '#0000ff'
              } else if (value > 100) {
                // 大于100的红色
                return '#ff0000'
              }
            })
            .size('a', (value) => {
              // 根据value值设置点的大小
              let a = value / 100 + 2;
              return a;
            })
            .active(true);
          scene.addLayer(layer);
        });
    });
  </script>
</body>

</html>
5.2 案例二:路网数据获取与L7可视化
下面记述使用L7对路网数据进行可视化
5.2.1 数据获取
路网数据可以从以下网站下载,数据来源自OSM:Index of /extracts (openstreetmap.fr)
其中,中国的路网数据可以从这个下载:Index of /extracts/asia/china (openstreetmap.fr)
笔者这里下载上海的数据:http://download.openstreetmap.fr/extracts/asia/china/shanghai.osm.pbf
下载好以后可以直接拖入QGIS中:
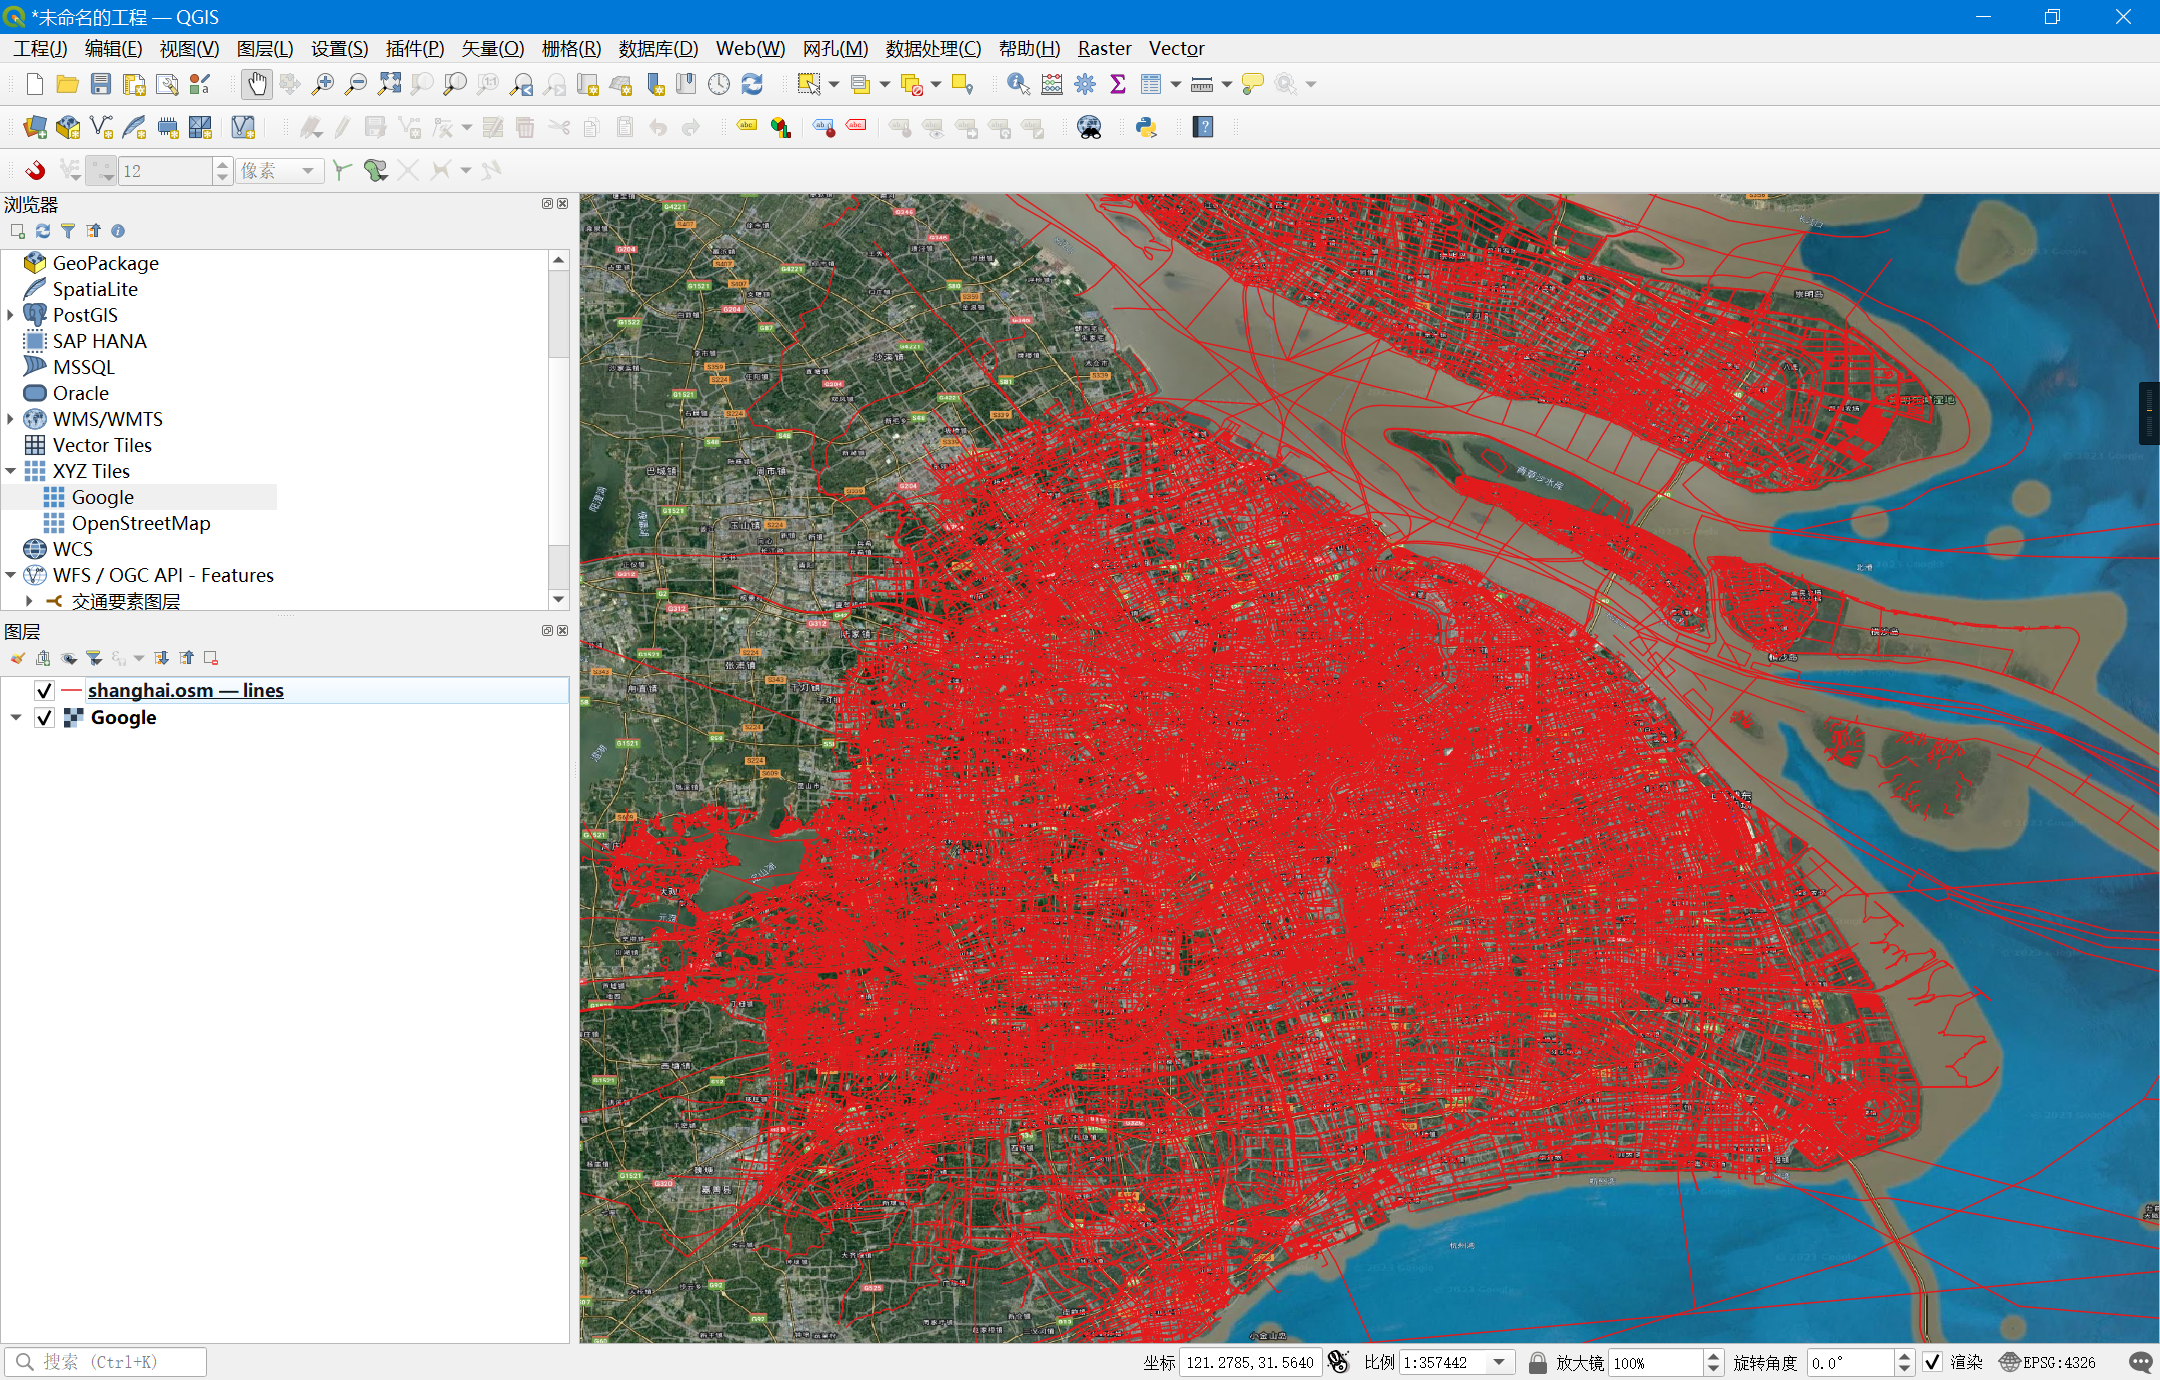
- 注:这里加载了
Lines,数据量较大,绘制卡顿。且路网质量也欠佳
在图层上右键选择导出:
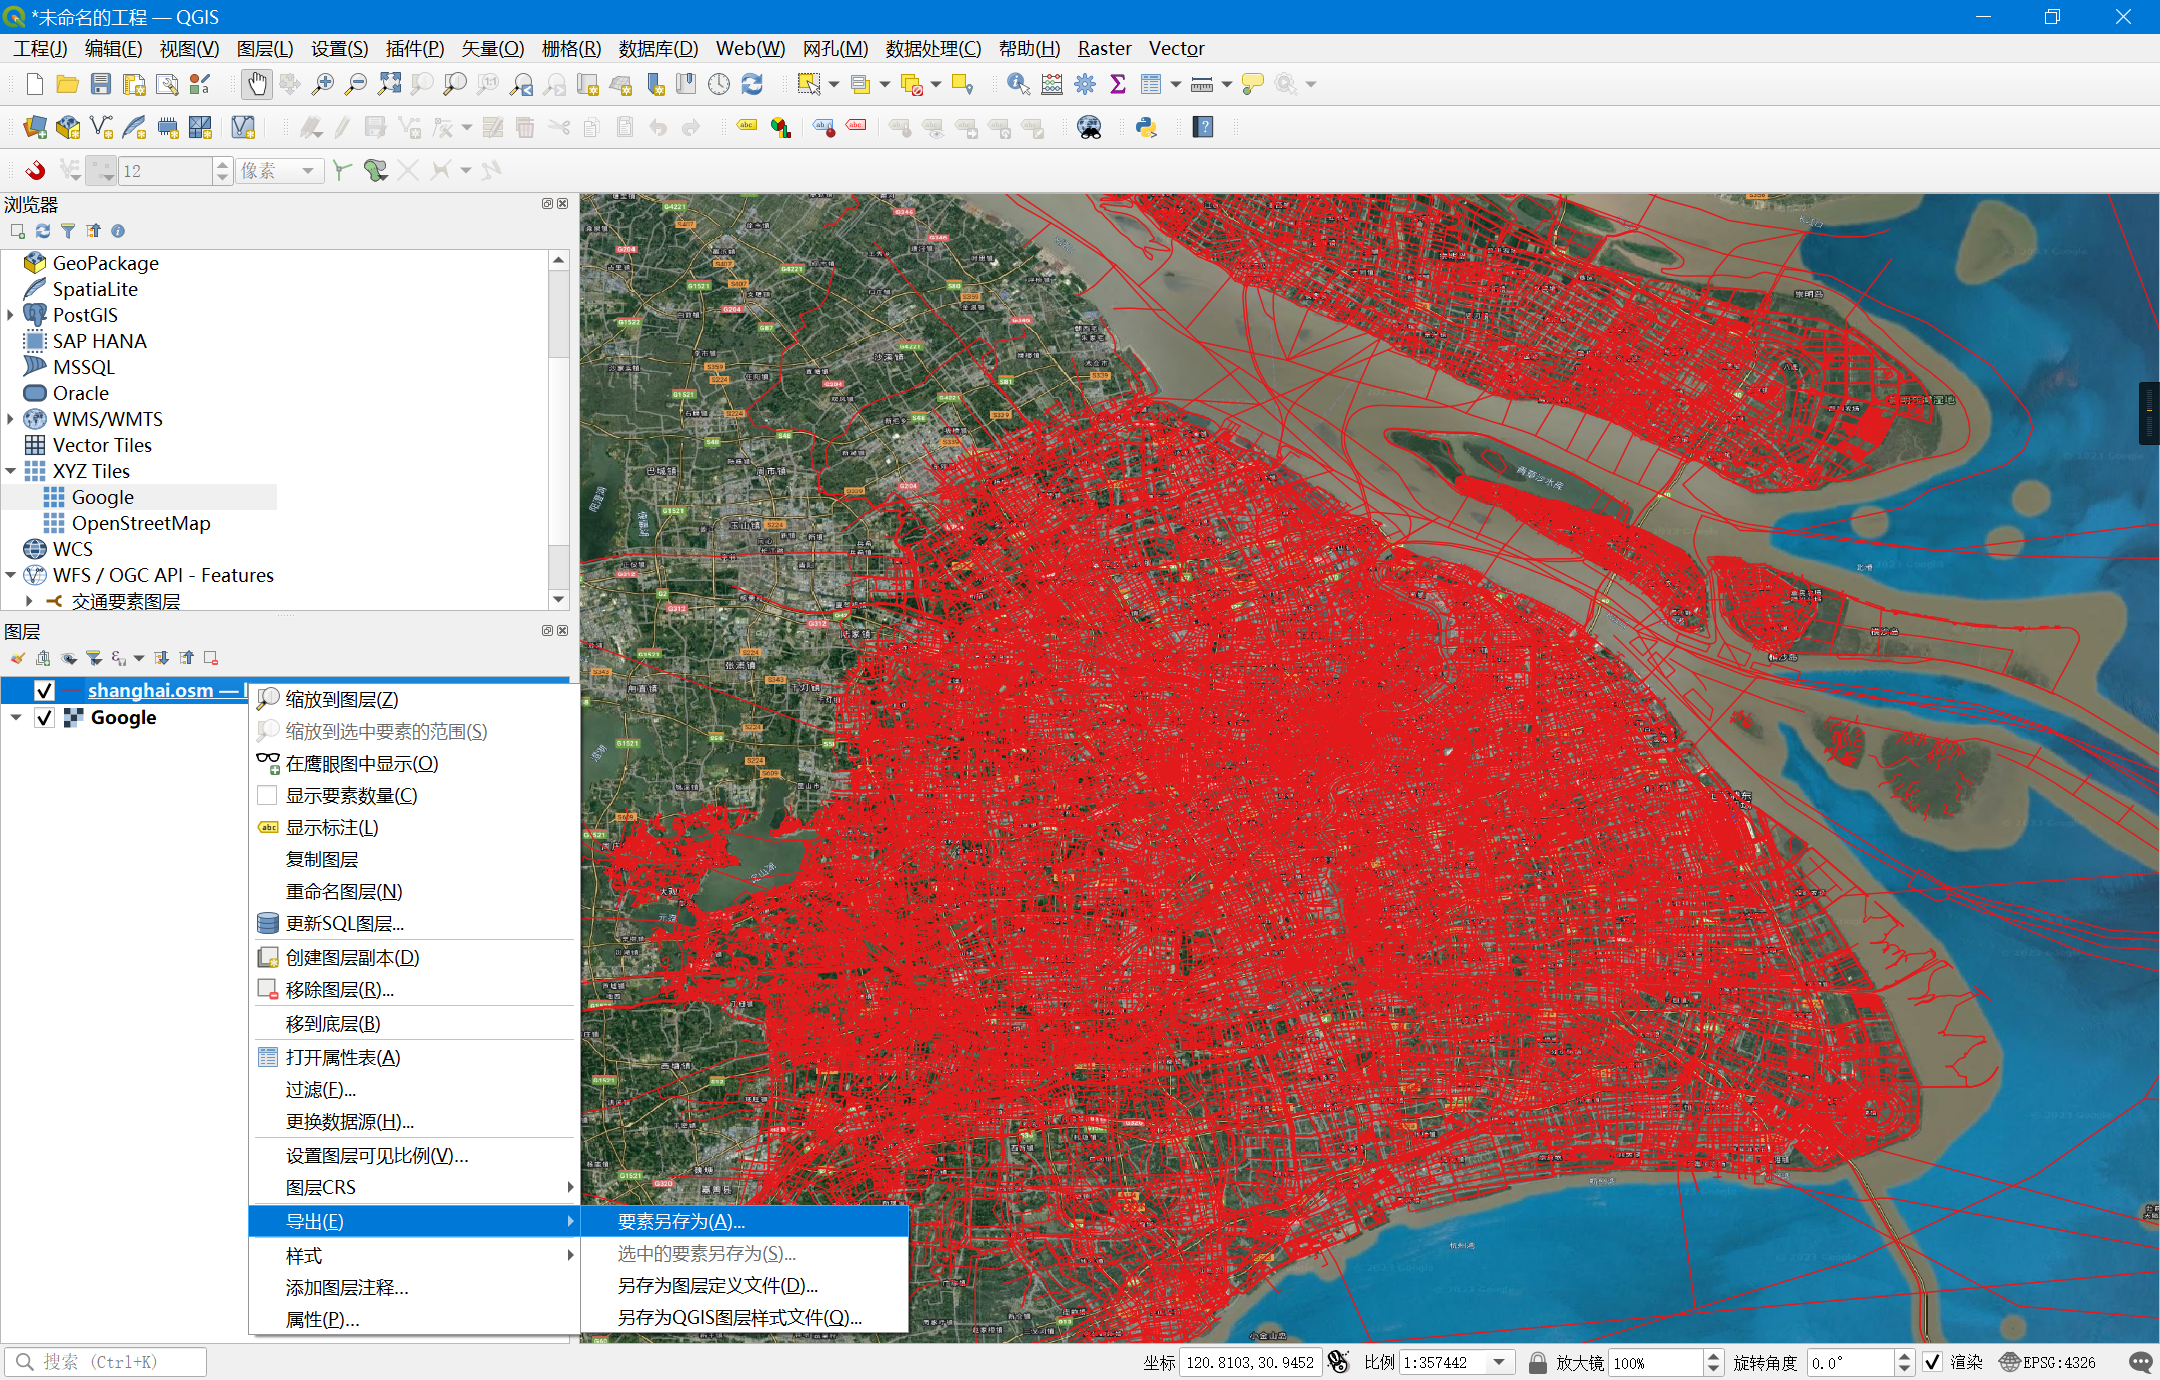
导出为GeoJSON:
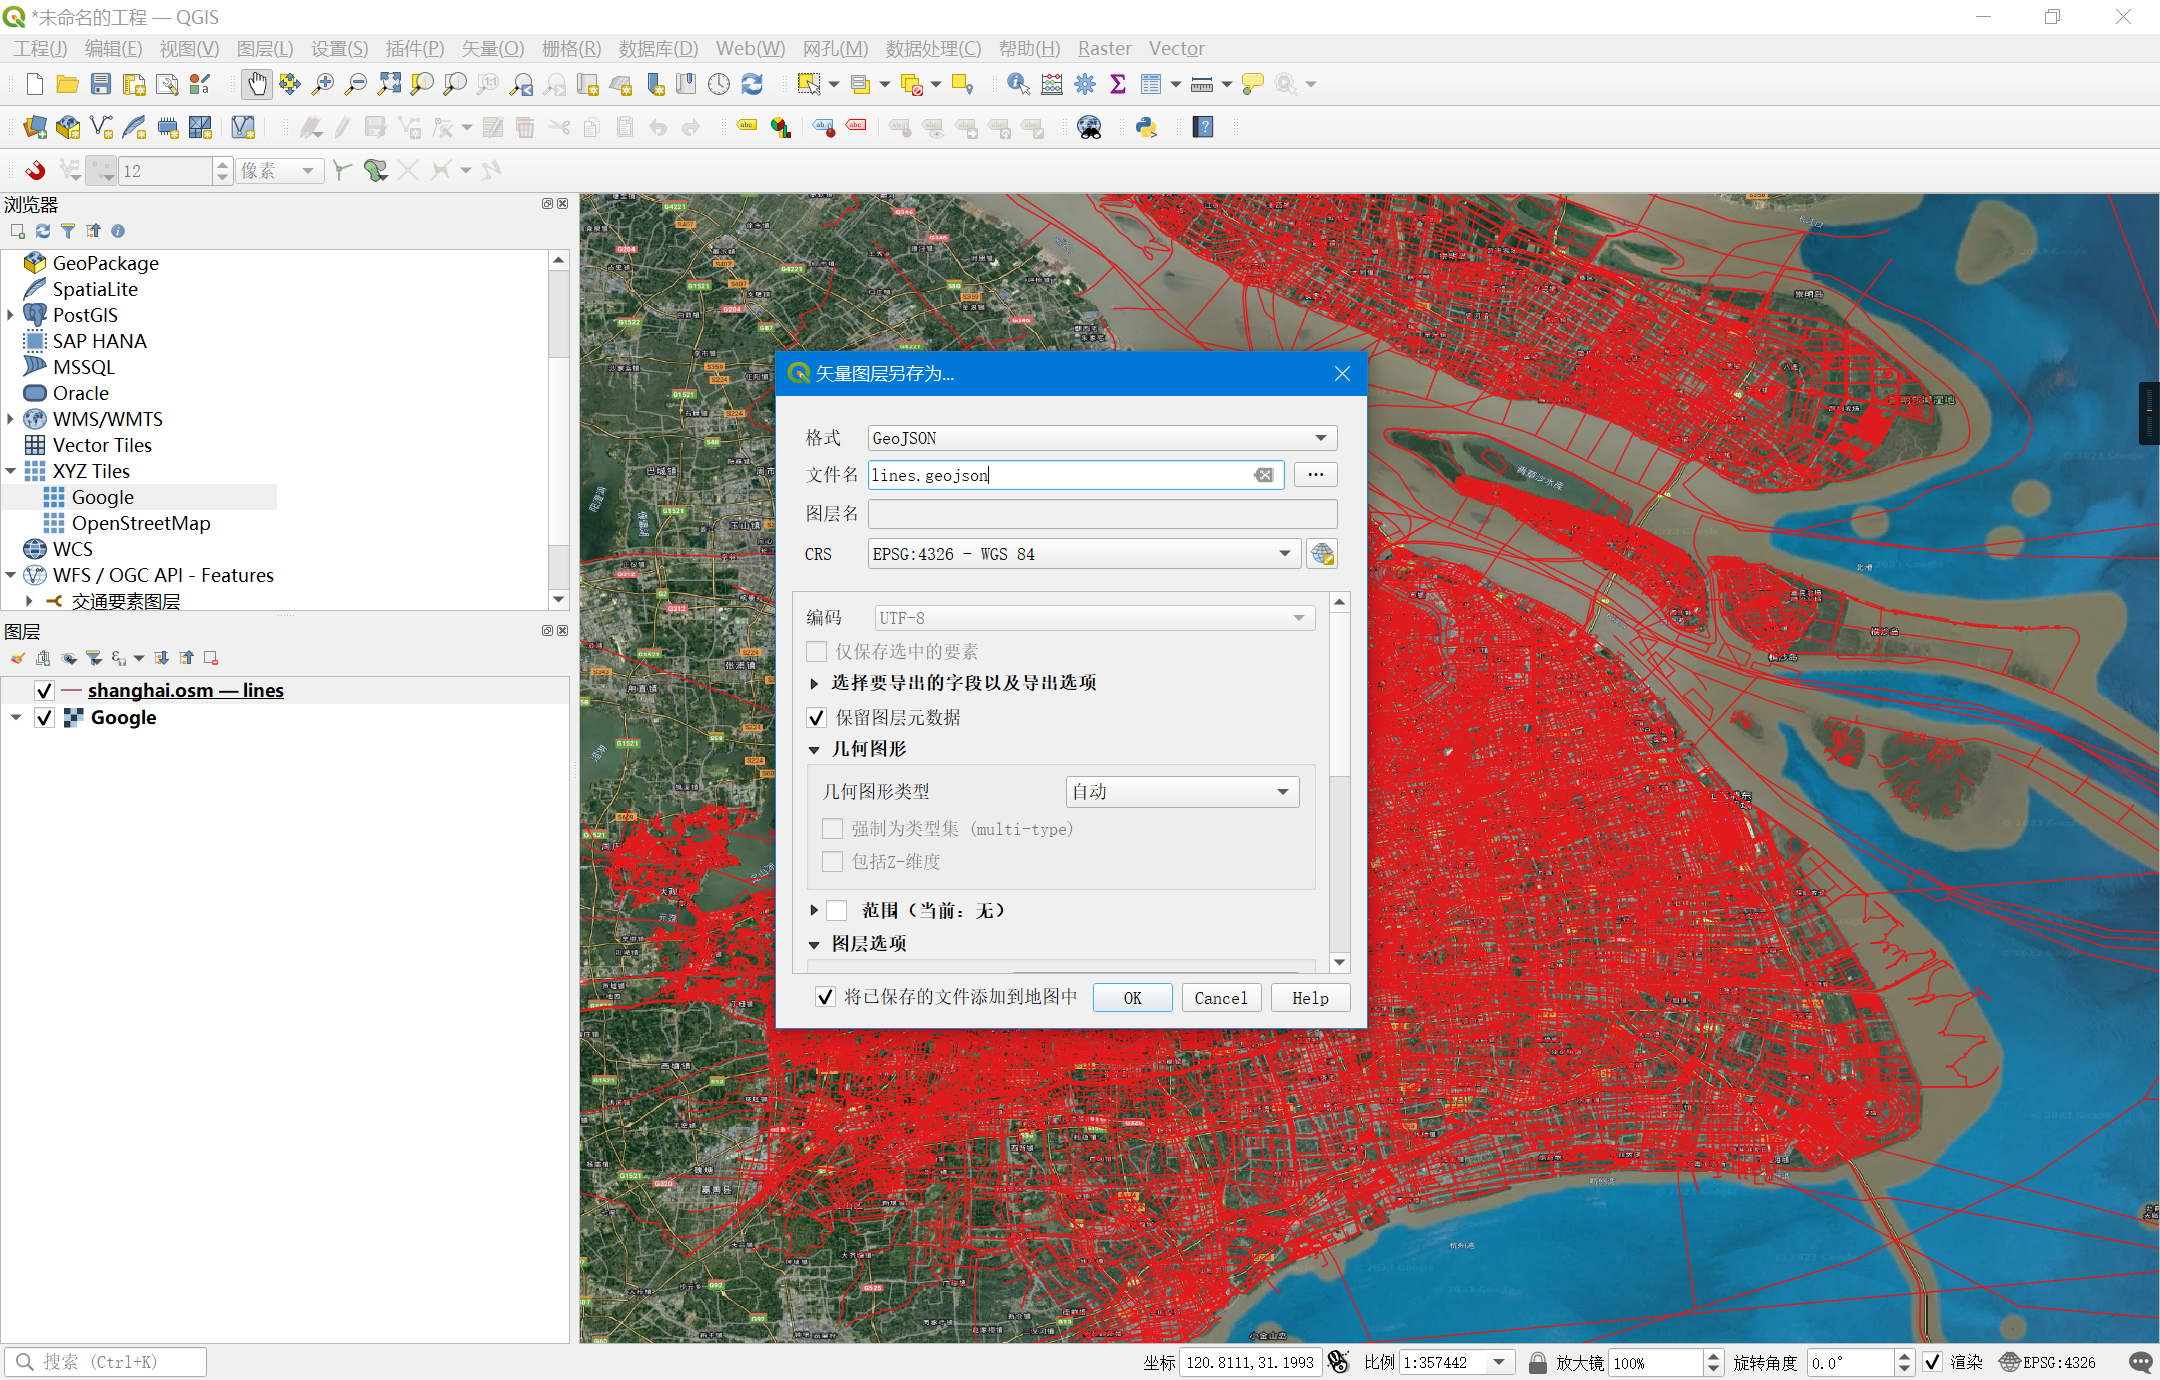
导出的数据尺寸为84 MB,至此数据获取完成
5.2.2 L7可视化
可参考官方路网图样例:路径地图 | L7 (antgroup.com)
5.2.2.1 加载底图
加载高德地图
<!DOCTYPE html>
<html lang="en">

<head>
  <meta charset="UTF-8">
  <meta http-equiv="X-UA-Compatible" content="IE=edge">
  <meta name="viewport" content="width=device-width, initial-scale=1.0">
  <title>Document</title>
  <script src='https://unpkg.com/@antv/l7'></script>
  <style>
    body,
    #map {
      height: 100vh;
      width: 100vw;
      margin: 0;
    }
  </style>
</head>

<body>
  <div id="map"></div>
  <script>
    const scene = new L7.Scene({
      id: 'map',
      map: new L7.GaodeMap({
        center: [116.3956, 39.9392],
        zoom: 2,
        style: 'light'
      })
    });
  </script>
</body>

</html>
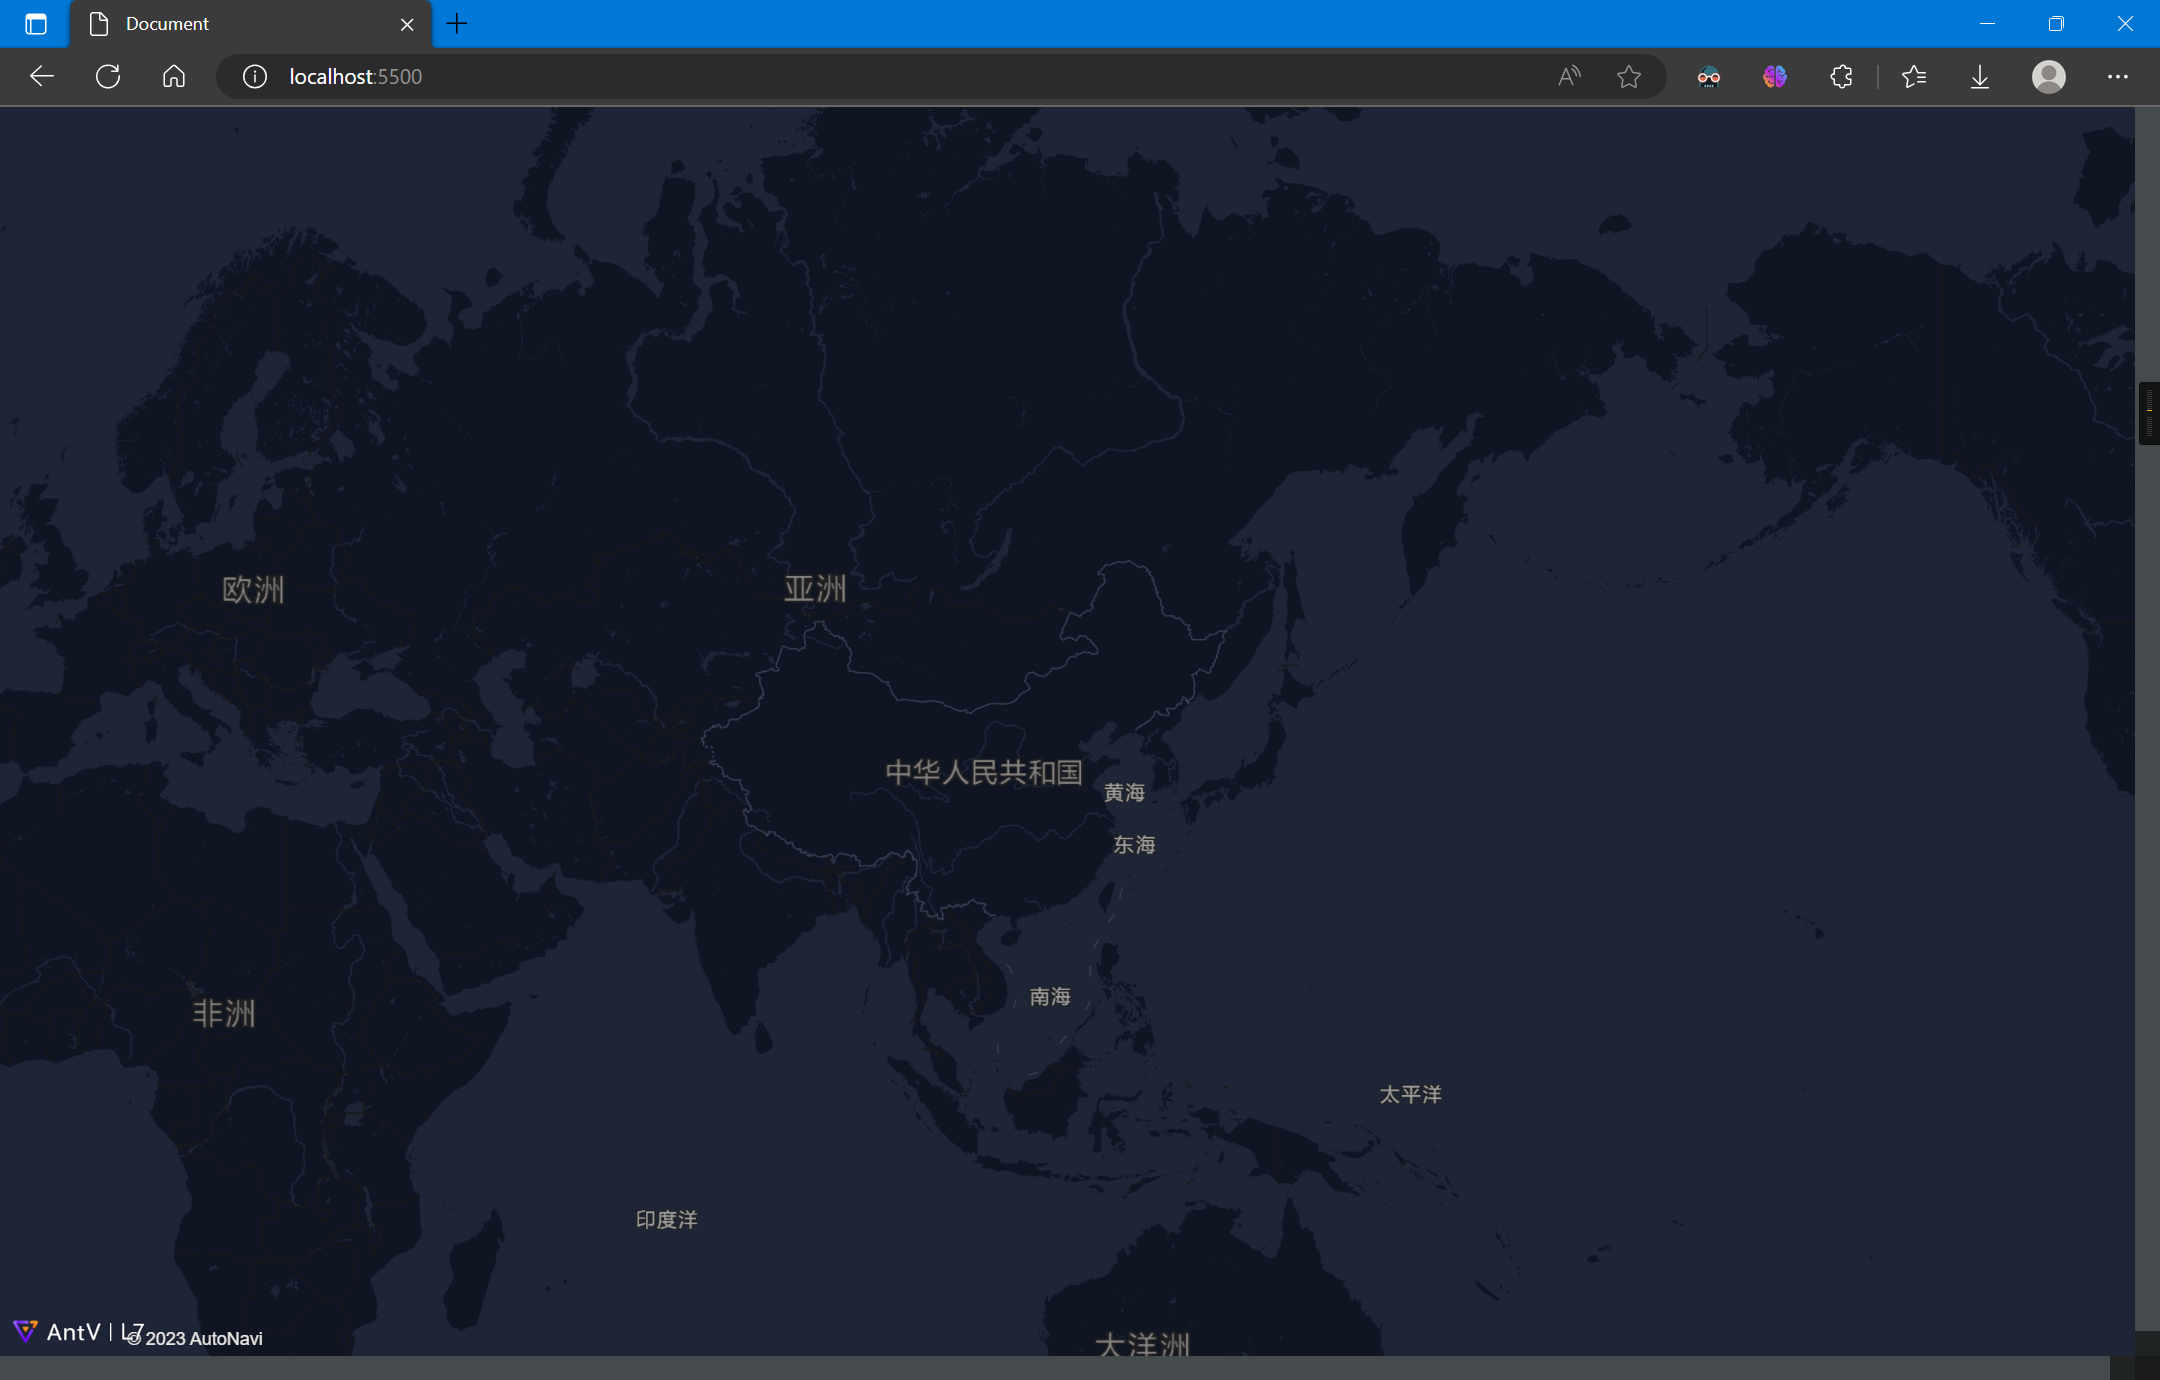
5.2.2.2 加载数据并解析
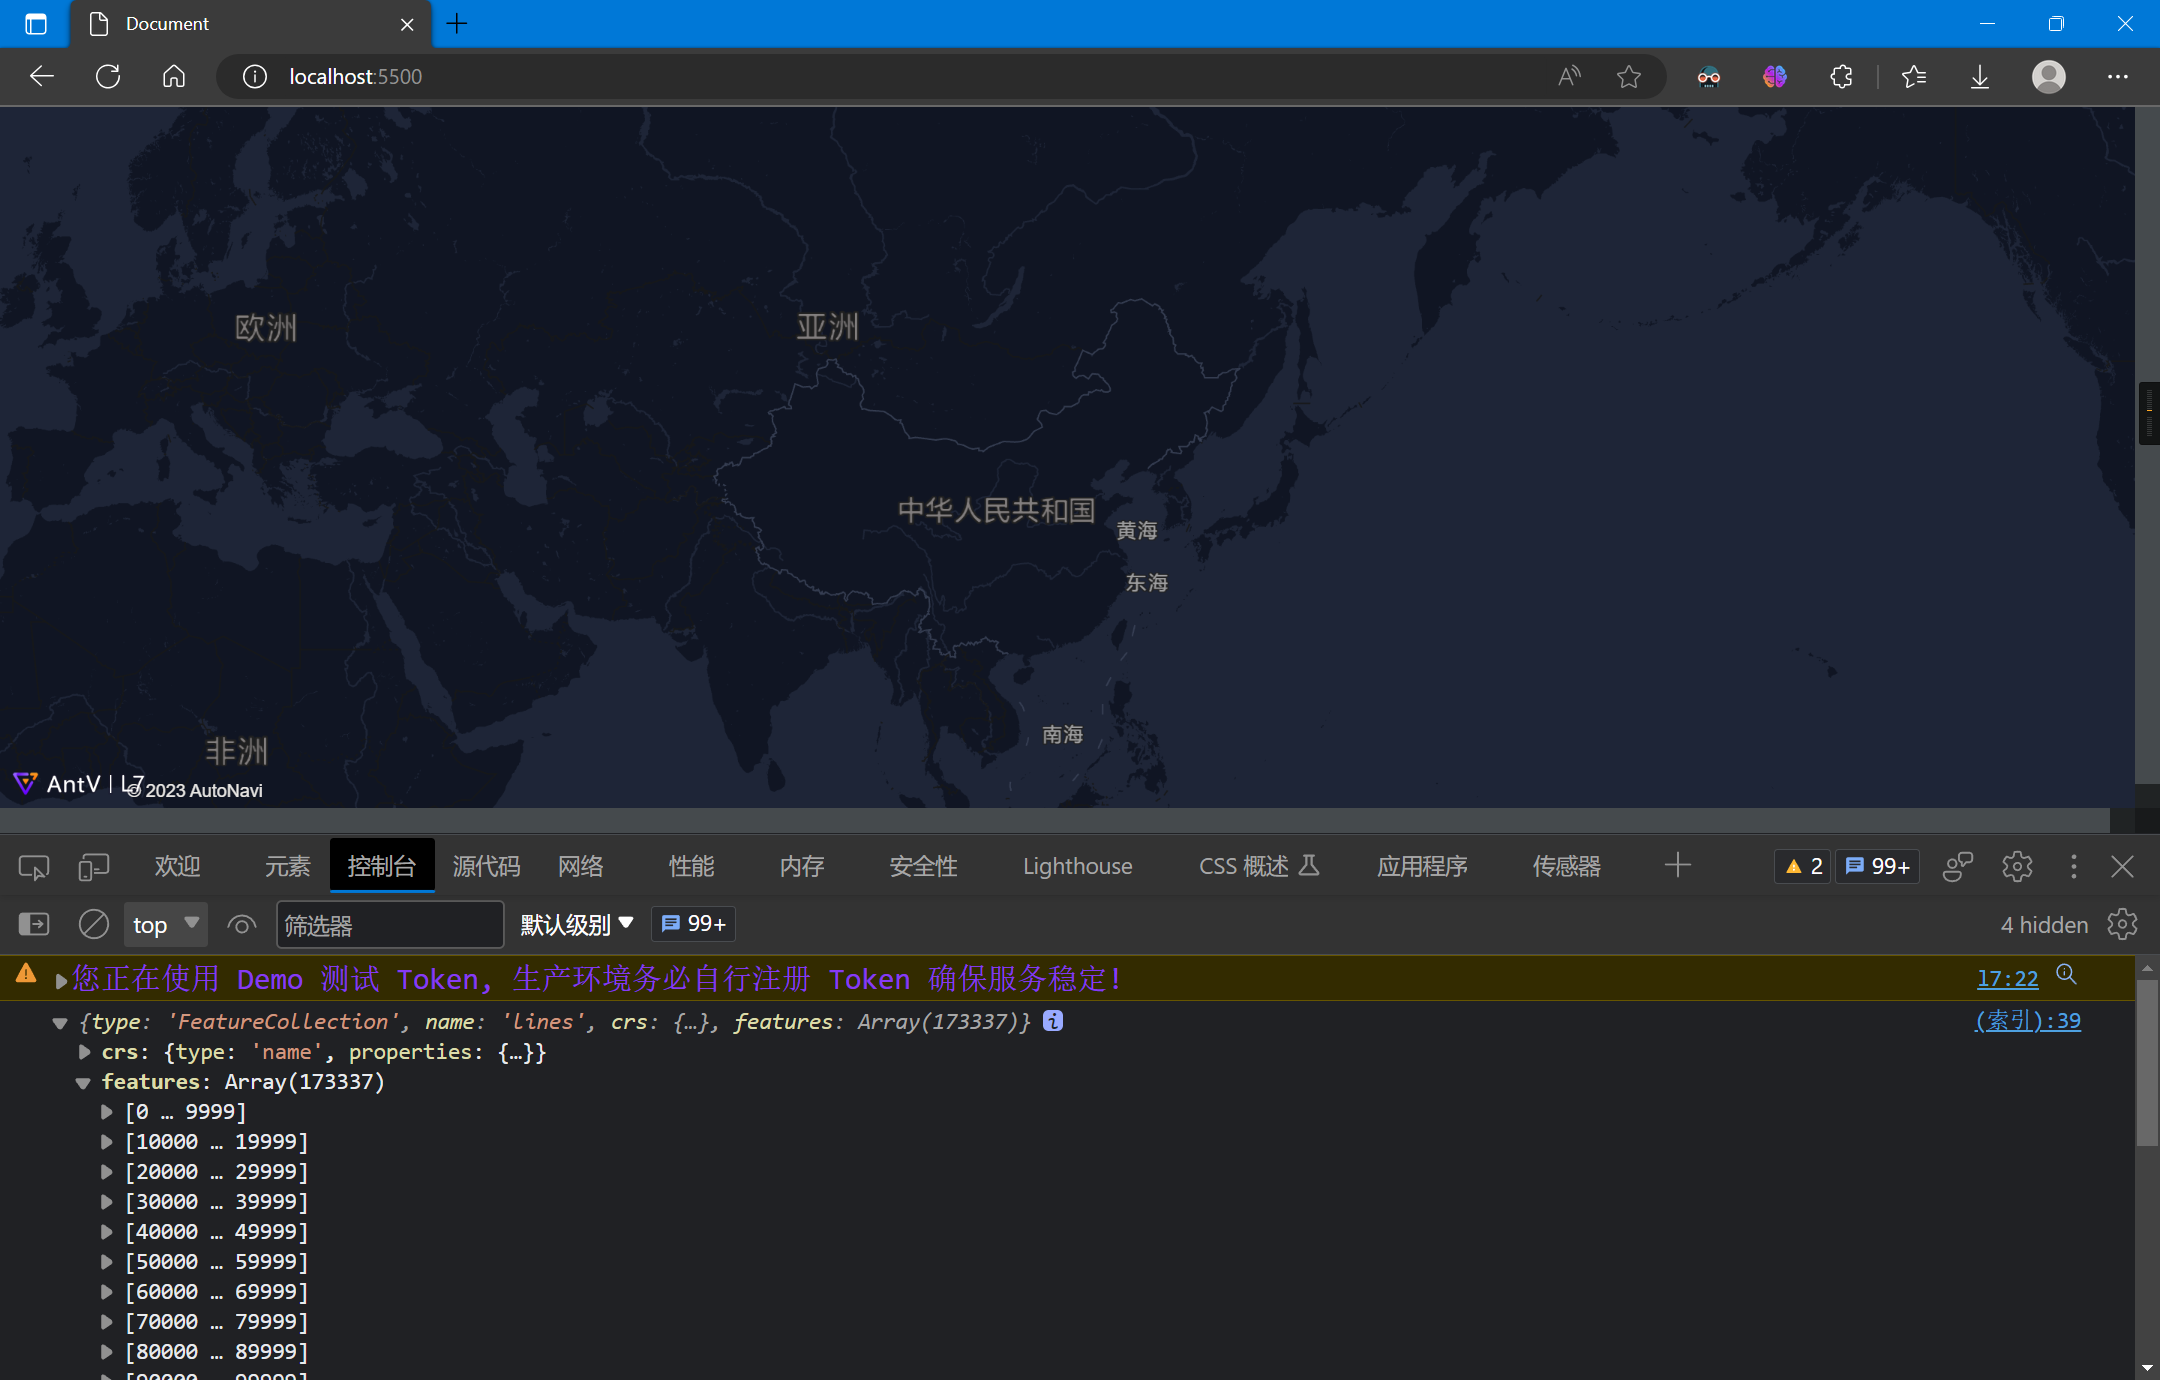
加载数据,L7对于GeoJSON无需额外设置解析器:
scene.on('loaded', () => {
    fetch('./lines.geojson')
        .then(res => res.json())
        .then(data => {
        console.log(data);
    })
});
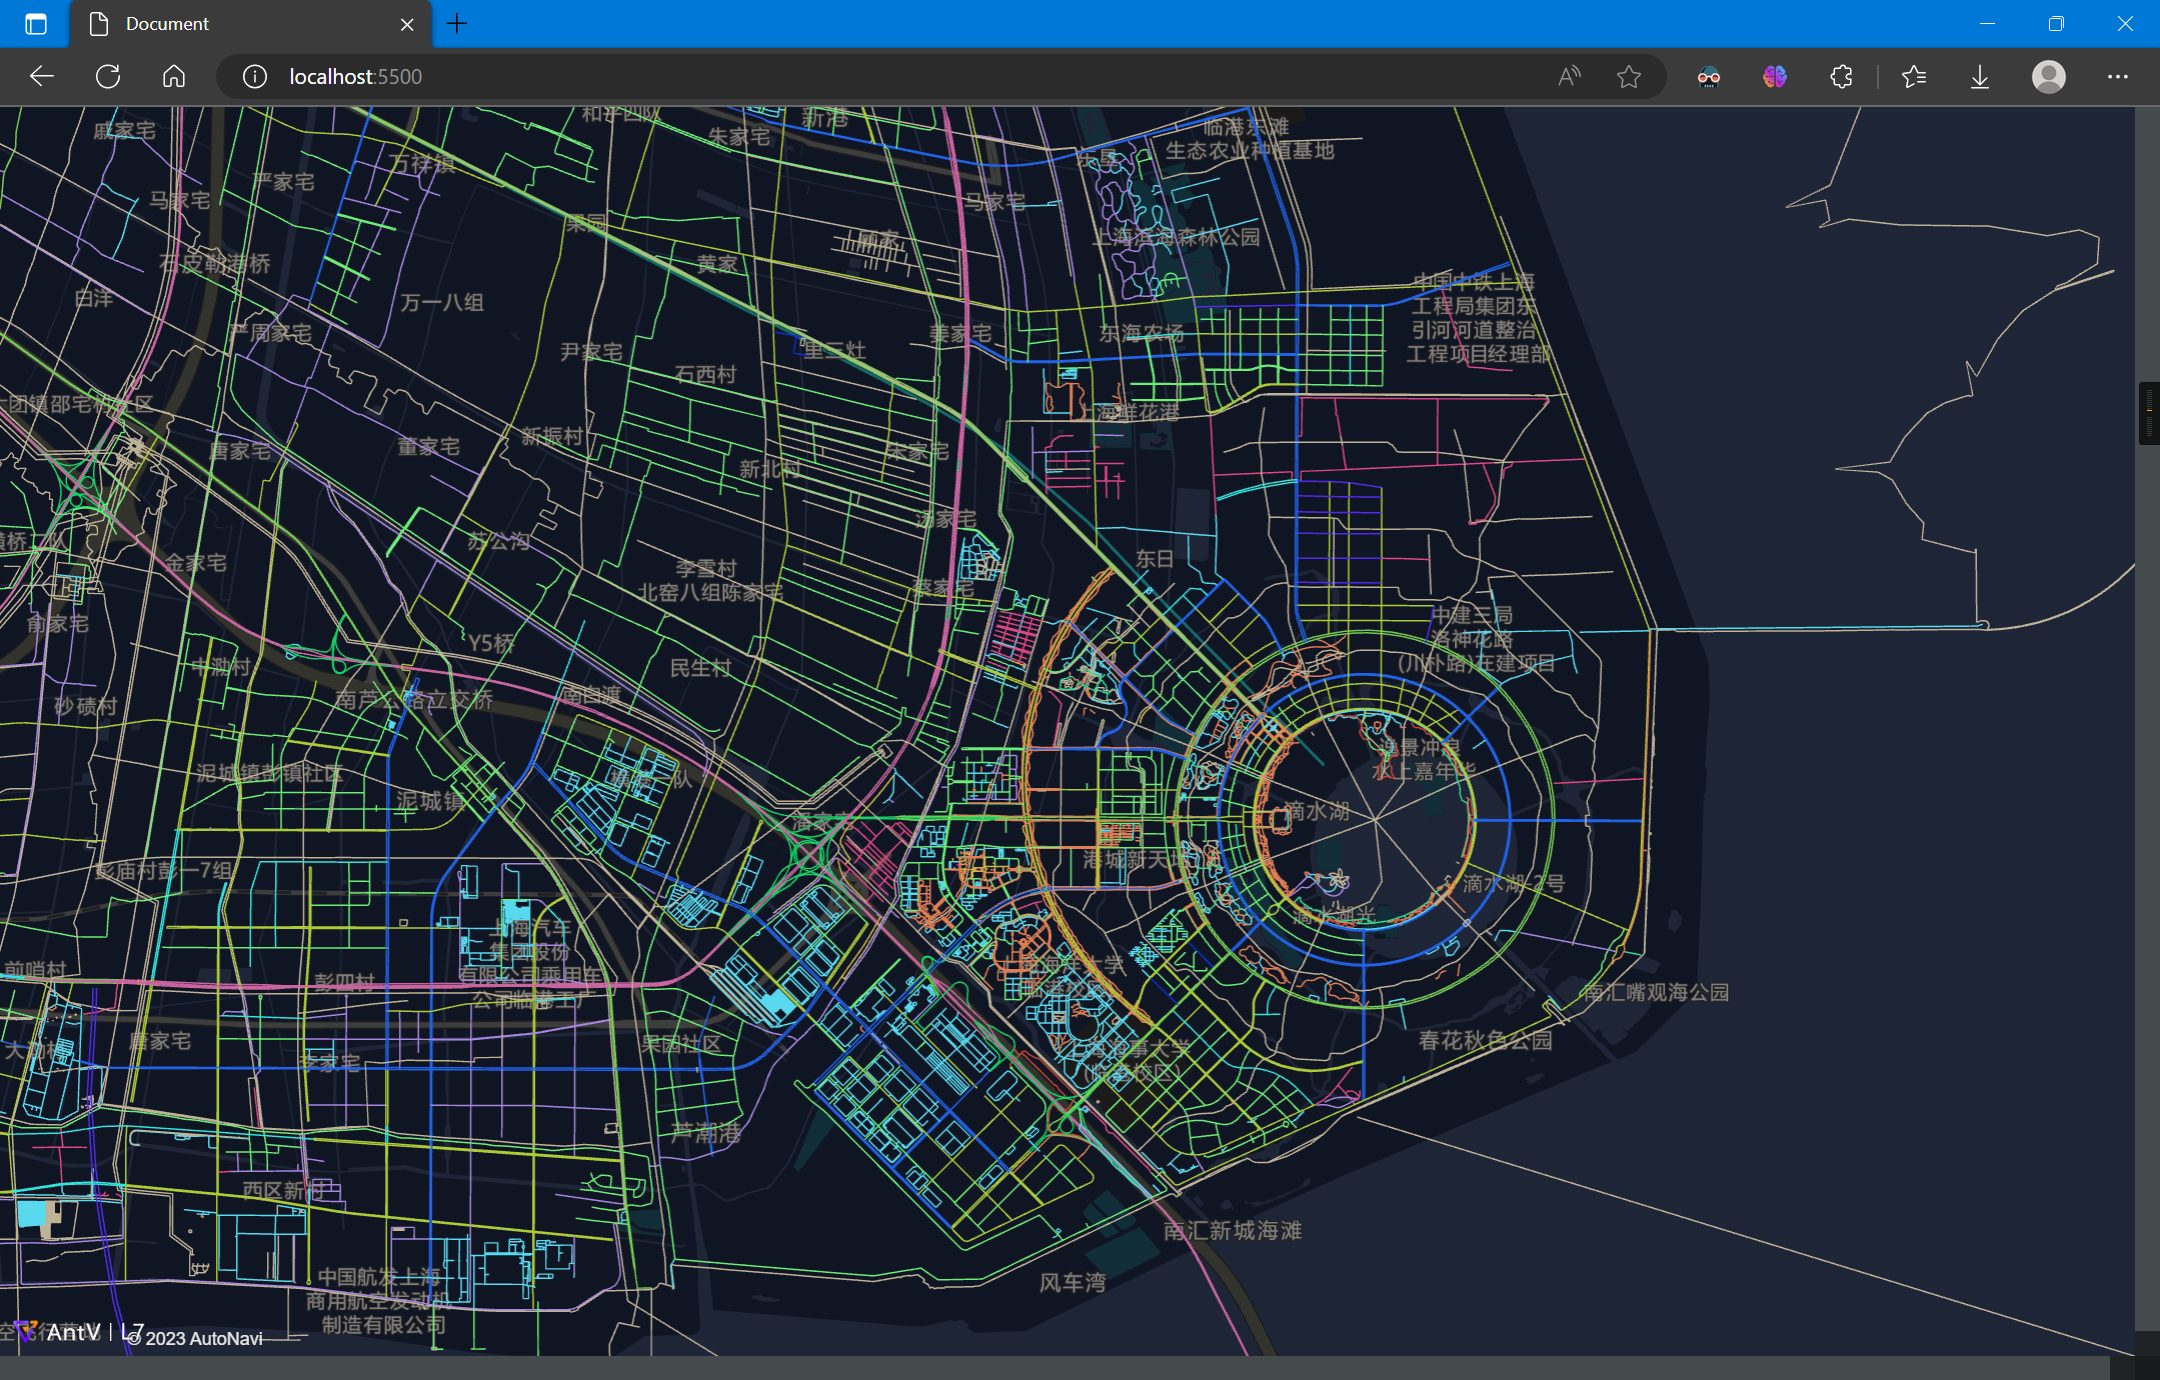
5.2.2.3 绘制样式
绘制线图层,并设置样式:
const layer = new L7.LineLayer({
    zIndex: 2,
})
    .source(data)
    .size(0.5)
    .active(true)
    .color('highway', (type) => {
        switch (type) {
            case "bridleway"  :
                return '#c81841';
            case "bus_guideway" :
                return '#39a0cc';
            case "bus_stop"  :
                return '#0d70cc';
            case "busway"  :
                return '#d385dd';
            case "construction"  :
                return '#30e5dc';
            case "corridor"  :
                return '#ca6166';
            case "cycleway"  :
                return '#c94534';
            case "elevator"  :
                return '#c3ee79';
            case "footway"  :
                return '#df7f53';
            case "living_street" :
                return '#0d2dce';
            case "motorway"  :
                return '#c8659f';
            case "motorway_link" :
                return '#15d066';
            case "path"  :
                return '#cab646';
            case "pedestrian" :
                return '#2ddb95';
            case "planned" :
                return '#36cd25';
            case "platform" :
                return '#d99b1f';
            case "primary"  :
                return '#75cc53';
            case "primary_link" :
                return '#e31eb2';
            case "proposed"  :
                return '#4e2bec';
            case "raceway"  :
                return '#c8721c';
            case "residential" :
                return '#6ced77';
            case "road"  :
                return '#57e079';
            case "secondary" :
                return '#2063e9';
            case "secondary_link" :
                return '#7aec1d';
            case "service"  :
                return '#58d9ed';
            case "services"  :
                return '#1fe3b9';
            case "steps"  :
                return '#e010d2';
            case "tertiary"  :
                return '#adca37';
            case "tertiary_link"  :
                return '#d0d32e';
            case "track"  :
                return '#e04684';
            case "trunk"  :
                return '#b232e4';
            case "trunk_link"  :
                return '#822dcd';
            case "unclassified"  :
                return '#a686de';
            case "null"  :
                return '#1f1bef';
            case ""  :
                return '#beb297';
            default:
                return '#beb297';
        }
    });
scene.addLayer(layer);
});
5.2.2.4 完整代码
完整代码如下:
<!DOCTYPE html>
<html lang="en">

<head>
  <meta charset="UTF-8">
  <meta http-equiv="X-UA-Compatible" content="IE=edge">
  <meta name="viewport" content="width=device-width, initial-scale=1.0">
  <title>Document</title>
  <script src='https://unpkg.com/@antv/l7'></script>
  <style>
    body,
    #map {
      height: 100vh;
      width: 100vw;
      margin: 0;
    }
  </style>
</head>

<body>
  <div id="map"></div>
  <script>
    const scene = new L7.Scene({
      id: 'map',
      map: new L7.GaodeMap({
        center: [116.3956, 39.9392],
        zoom: 2,
        style: 'dark'
      })
    });

    scene.on('loaded', () => {
      fetch('./lines.geojson')
        .then(res => res.json())
        .then(data => {
          const layer = new L7.LineLayer({
            zIndex: 2,
          })
            .source(data)
            .size(0.5)
            .active(true)
            .color('highway', (type) => {
              switch (type) {
                case "bridleway"  :
                  return '#c81841';
                case "bus_guideway" :
                  return '#39a0cc';
                case "bus_stop"  :
                  return '#0d70cc';
                case "busway"  :
                  return '#d385dd';
                case "construction"  :
                  return '#30e5dc';
                case "corridor"  :
                  return '#ca6166';
                case "cycleway"  :
                  return '#c94534';
                case "elevator"  :
                  return '#c3ee79';
                case "footway"  :
                  return '#df7f53';
                case "living_street" :
                  return '#0d2dce';
                case "motorway"  :
                  return '#c8659f';
                case "motorway_link" :
                  return '#15d066';
                case "path"  :
                  return '#cab646';
                case "pedestrian" :
                  return '#2ddb95';
                case "planned" :
                  return '#36cd25';
                case "platform" :
                  return '#d99b1f';
                case "primary"  :
                  return '#75cc53';
                case "primary_link" :
                  return '#e31eb2';
                case "proposed"  :
                  return '#4e2bec';
                case "raceway"  :
                  return '#c8721c';
                case "residential" :
                  return '#6ced77';
                case "road"  :
                  return '#57e079';
                case "secondary" :
                  return '#2063e9';
                case "secondary_link" :
                  return '#7aec1d';
                case "service"  :
                  return '#58d9ed';
                case "services"  :
                  return '#1fe3b9';
                case "steps"  :
                  return '#e010d2';
                case "tertiary"  :
                  return '#adca37';
                case "tertiary_link"  :
                  return '#d0d32e';
                case "track"  :
                  return '#e04684';
                case "trunk"  :
                  return '#b232e4';
                case "trunk_link"  :
                  return '#822dcd';
                case "unclassified"  :
                  return '#a686de';
                case "null"  :
                  return '#1f1bef';
                case ""  :
                  return '#beb297';
                default:
                  return '#beb297';
              }
            });
          scene.addLayer(layer);
        });
    });

  </script>
</body>

</html>
6. 综合案例:基于众源轨迹数据的三维路网生成与L7可视化
下面记述使用L7对长沙岳麓山景点游客轨迹数据进行可视化并构建三维路网的综合案例
6.1 数据获取
路网数据可以从以下网站下载,数据来源自六只脚:六只脚_GPS轨迹记录_户外自助游_自助游线路 (foooooot.com)
具体的轨迹获取教程可以参考:GPS地图生成03之数据获取 - 当时明月在曾照彩云归 - 博客园 (cnblogs.com)
下载好以后可以在QGIS中利用加载XY文件的方式加载all.csv文件,并设置OSM底图,预览GPS轨迹:
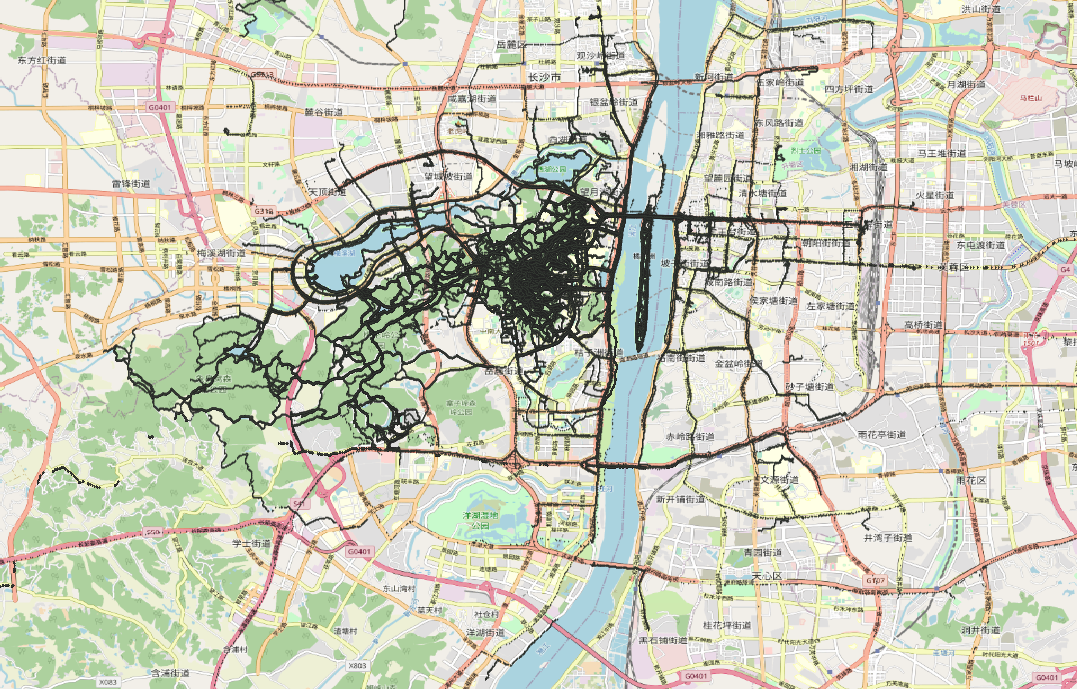
- 注:数据量较大,绘制卡顿
数据文件尺寸为47.2 M,有892152条轨迹数据,至此数据获取完成
数据文件内容示例为:
id,lng,lat,ele,track,time
0,112.938652777778,28.1828777777778,52.5862003780718,1448263,1511330079
1,112.936425,28.1837833333333,63.8200589970501,1448263,1511330738
2,112.936280555556,28.1837833333333,64.1105651105651,1448263,1511330800
3,112.93595,28.18385,65.3336643495531,1448263,1511331332
4,112.935691666667,28.1839333333333,66.9243986254296,1448263,1511331794
5,112.932275,28.1840388888889,80.1450980392157,1448263,1511335690
6,112.929519444444,28.1849583333333,179.382636655949,1448263,1511336583
7,112.929244444444,28.1849777777778,185.630363036304,1448263,1511336714
8,112.928458333333,28.1860111111111,228.579710144928,1448263,1511337087
9,112.931161111111,28.1911555555556,285.57196969697,1448263,1511339434
10,112.931288888889,28.1910944444444,288.503448275862,1448263,1511339460
......
6.2 L7可视化
可参考官方亮度图样例:亮度图 | L7 (antgroup.com)
6.2.1 加载底图
加载Mapbox地图
<!DOCTYPE html>
<html lang="en">

<head>
  <meta charset="UTF-8">
  <meta http-equiv="X-UA-Compatible" content="IE=edge">
  <meta name="viewport" content="width=device-width, initial-scale=1.0">
  <title>Document</title>
  <script src='https://api.mapbox.com/mapbox-gl-js/v2.15.0/mapbox-gl.js'></script>
  <link href='https://api.mapbox.com/mapbox-gl-js/v2.15.0/mapbox-gl.css' rel='stylesheet' />
  <script src='https://unpkg.com/@antv/l7'></script>
</head>

<body>
  <div id="map"></div>
  <script>
    const scene = new L7.Scene({
      id: 'map',
      map: new L7.Mapbox({
        style: 'dark',
        center: [112.9448, 28.1708],
        zoom: 12,
        token: 'pk.eyJ1IjoieWFuZ2ppYW4iLCJhIjoiY2phaG1neno0MXFkNDMzbWhwNWw0bWM4aiJ9.CFmrh0LVWAbmVeed-Xr7wA'
      }),
    });

  </script>
</body>

</html>
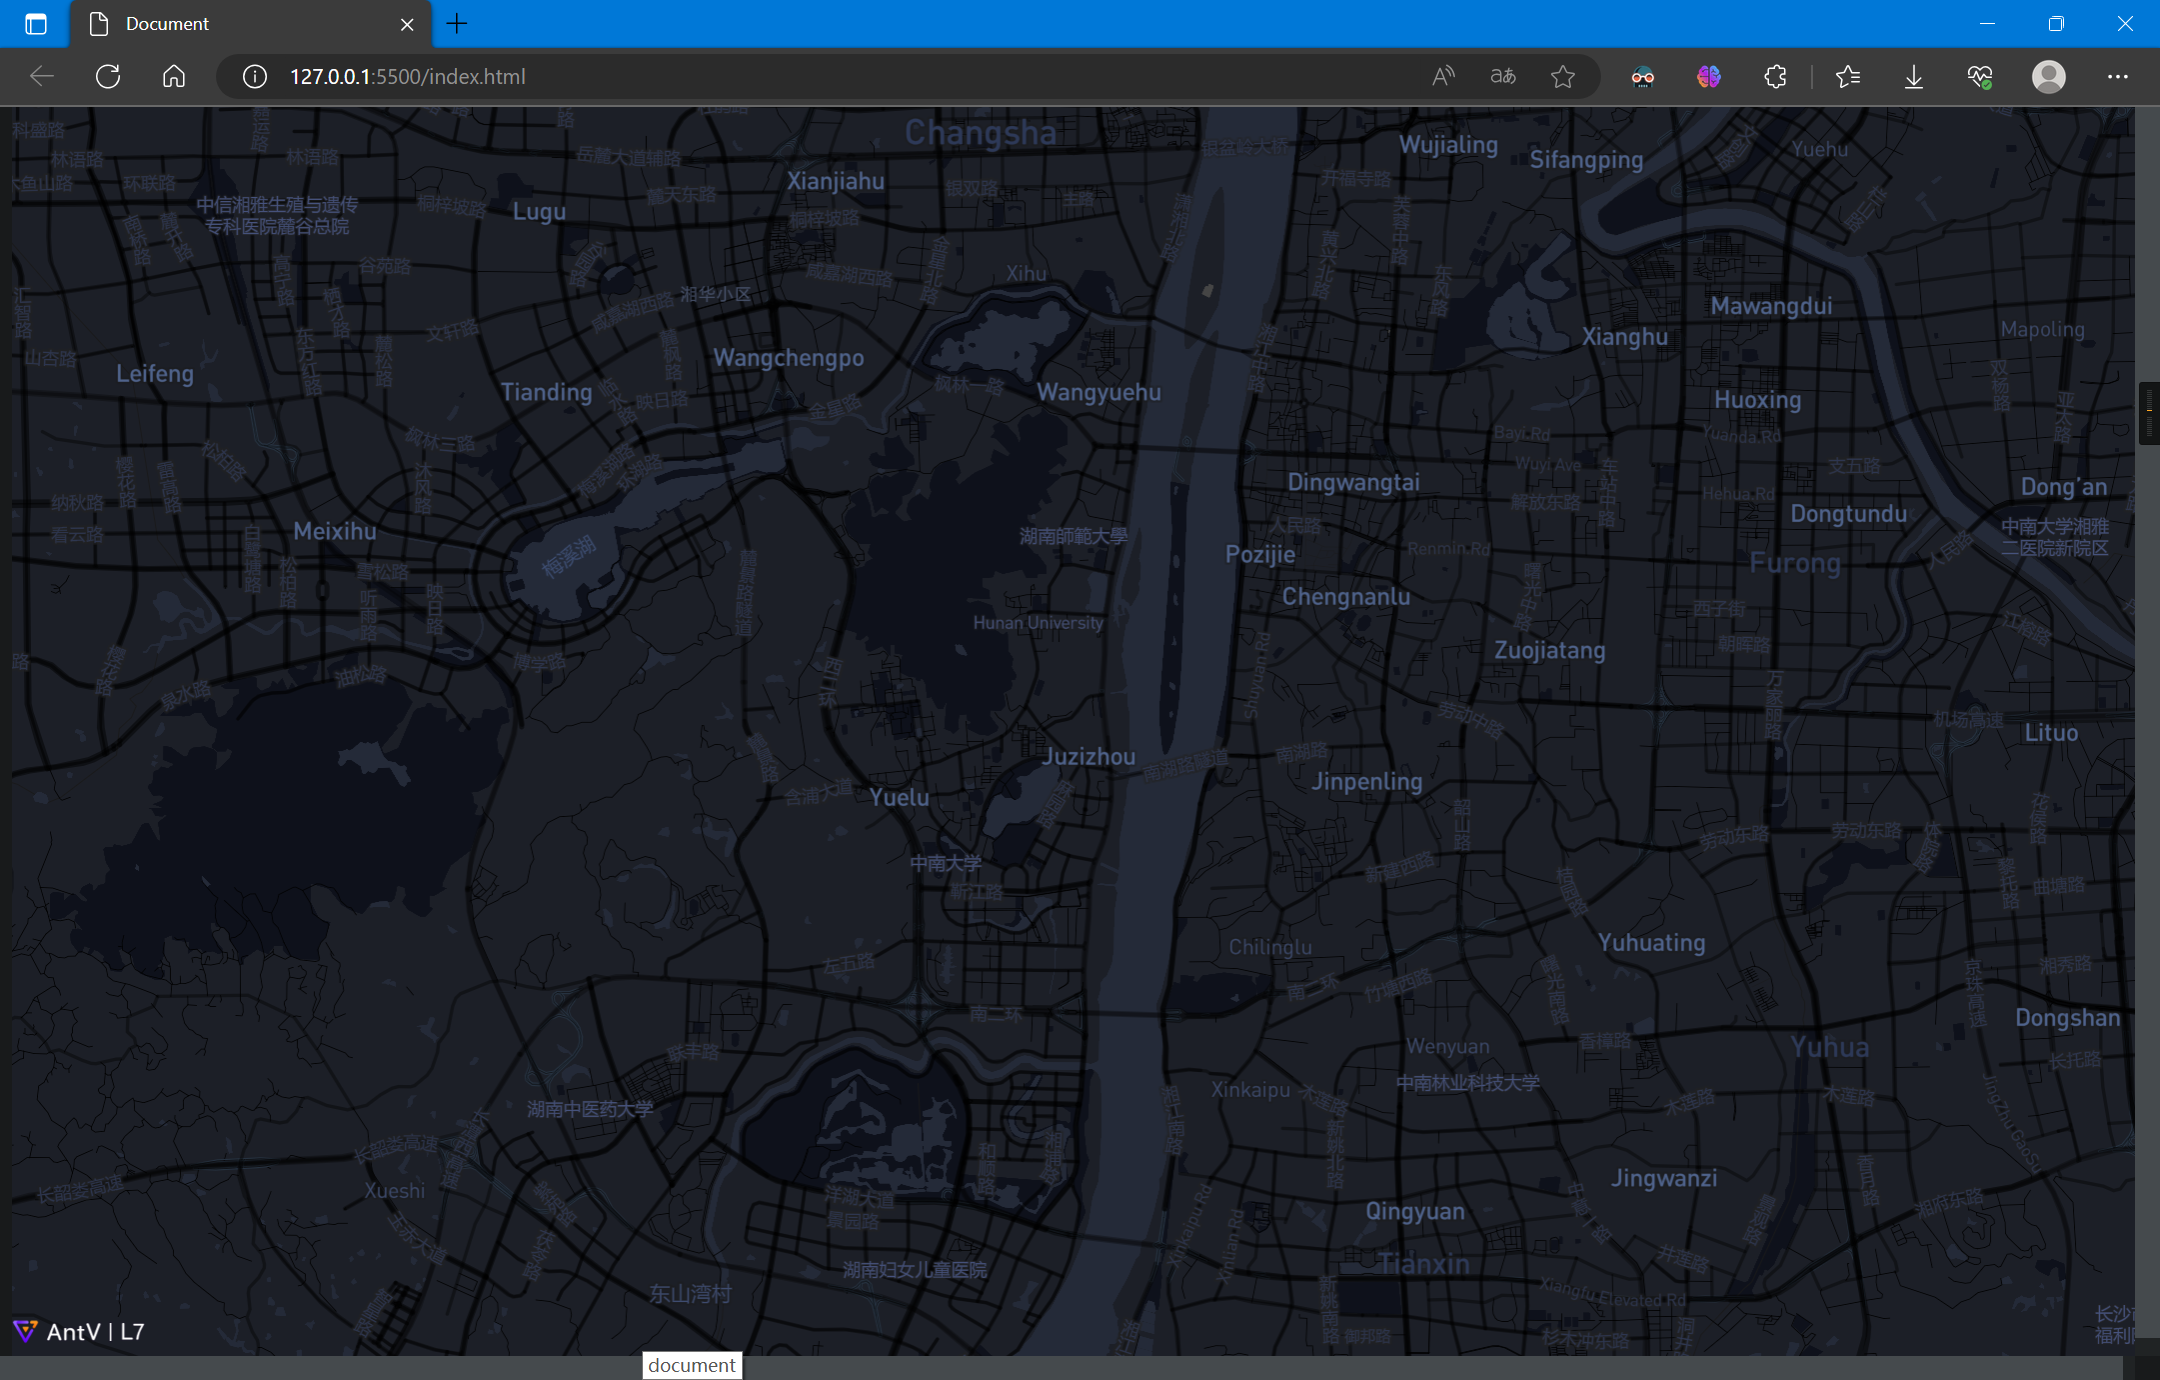
6.2.2 加载数据并解析
加载数据,L7内置CSV格式解析器,只需指定字段名即可:
scene.on('loaded', () => {
    fetch('./all.csv')
        .then(res => res.text())
        .then(data => {
        const pointLayer = new L7.PointLayer({})
        .source(data, {
            parser: {
                type: 'csv',
                y: 'lat',
                x: 'lng'
            }
        })

        scene.addLayer(pointLayer);
    });
});
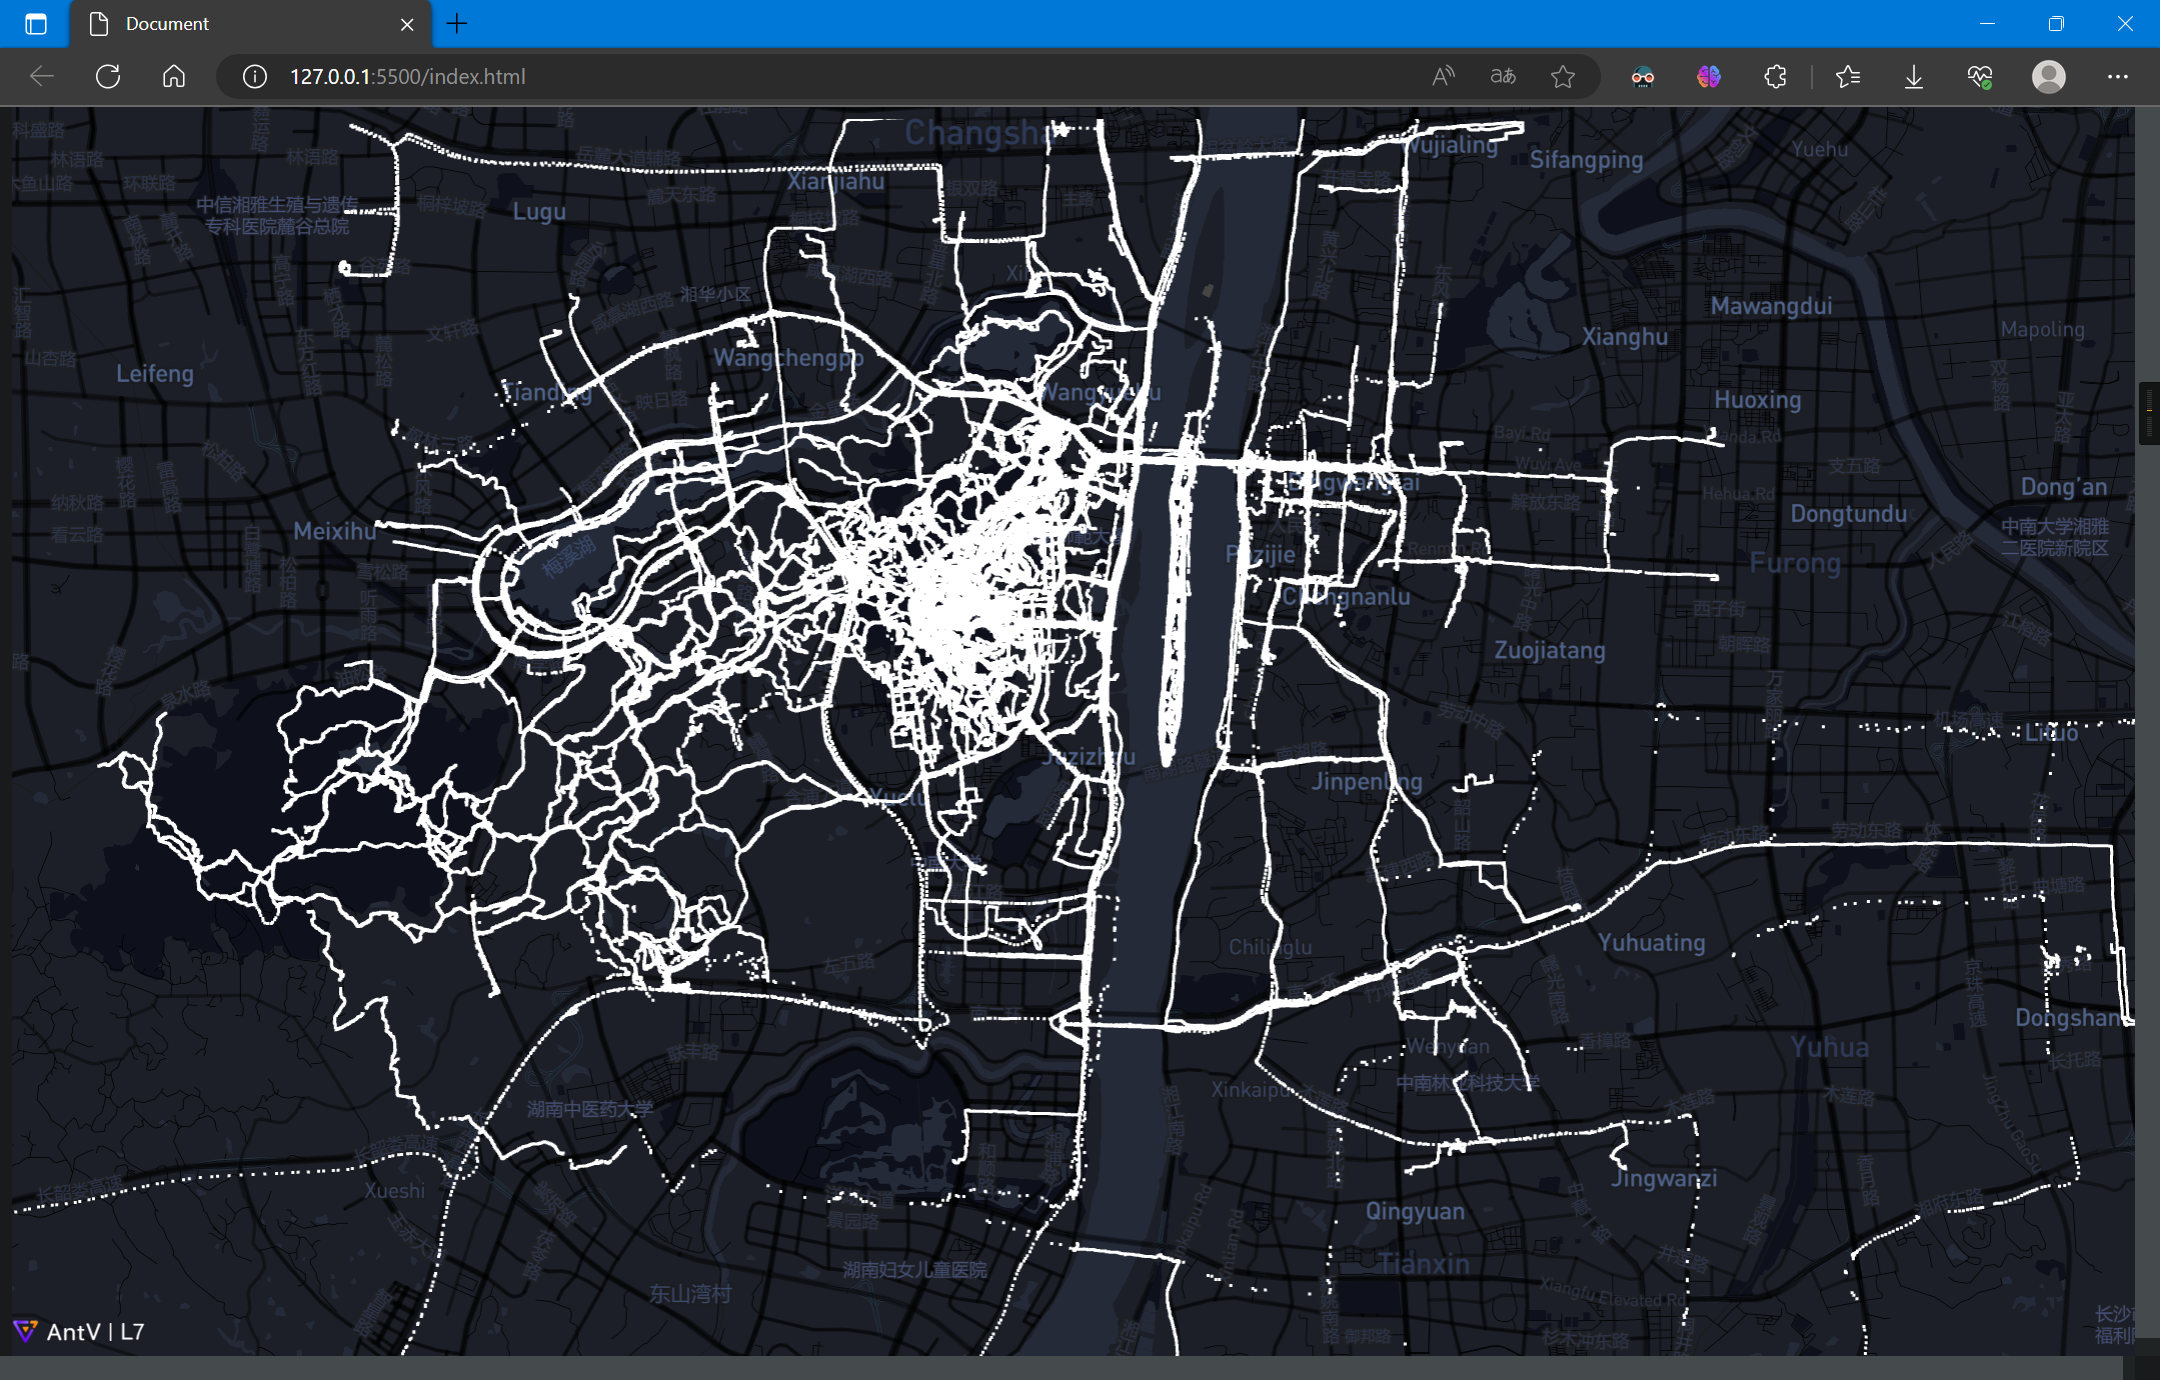
6.2.3 绘制样式
绘制点图层,并设置样式:
scene.on('loaded', () => {
    fetch('./all.csv')
        .then(res => res.text())
        .then(data => {
        const pointLayer = new L7.PointLayer({})
        .source(data, {
            parser: {
                type: 'csv',
                y: 'lat',
                x: 'lng'
            }
        })
        .size(0.5)
        .color('#080298');

        scene.addLayer(pointLayer);
    });
});
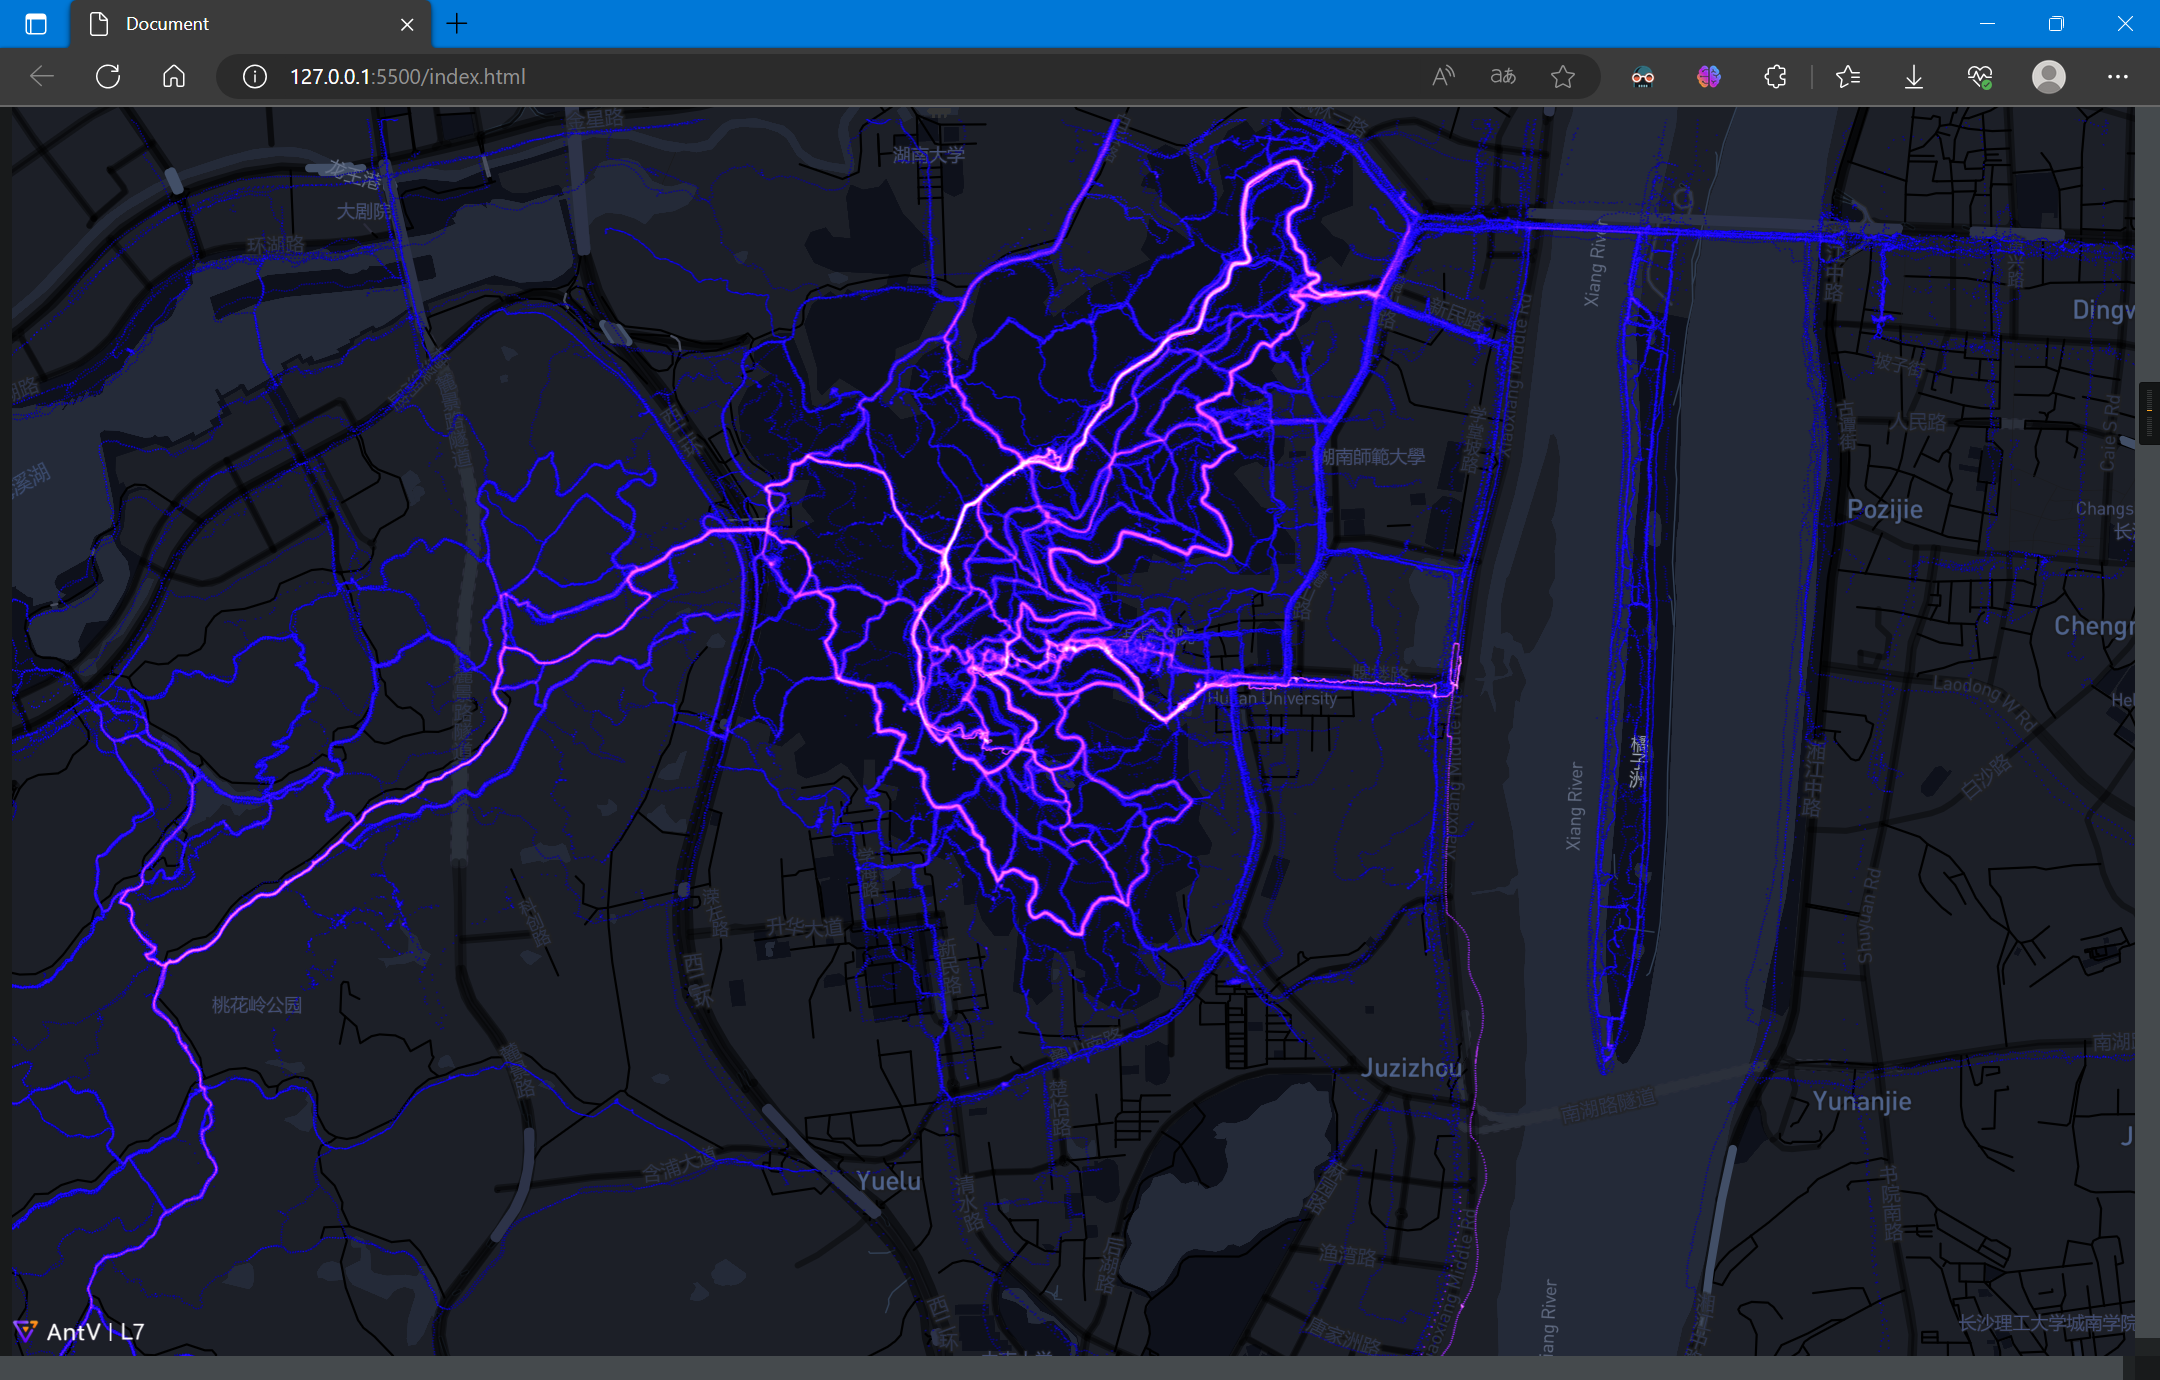
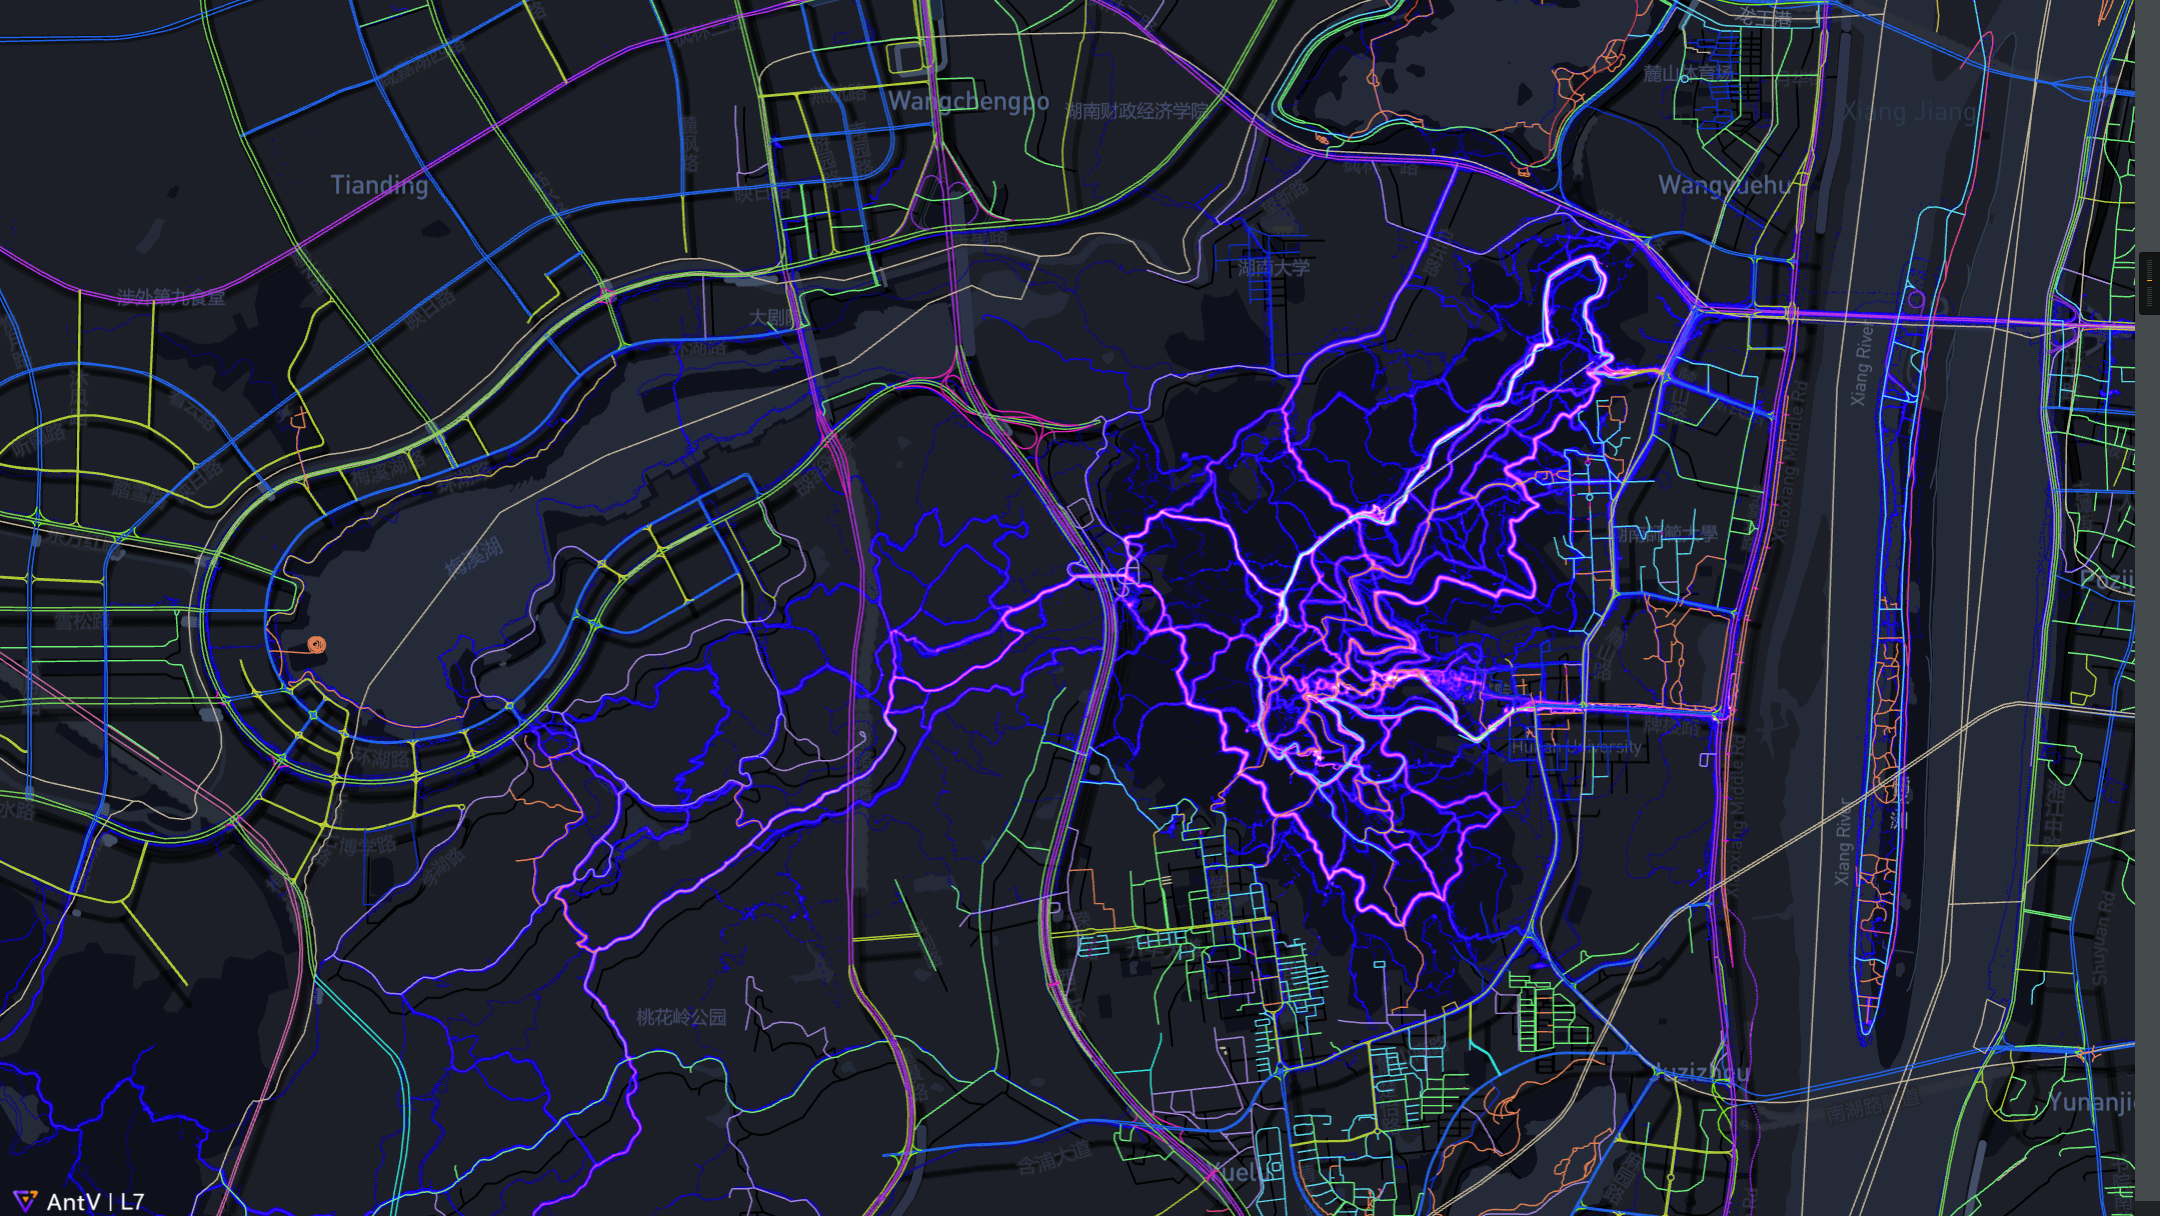
从图中可以看出主要的路线,即高亮部分
6.2.4 路网叠加
以下对景点及附近的路网数据可视化
路网数据获取与可视化步骤可参考:「AntV」路网数据获取与L7可视化 - 当时明月在曾照彩云归 - 博客园 (cnblogs.com)
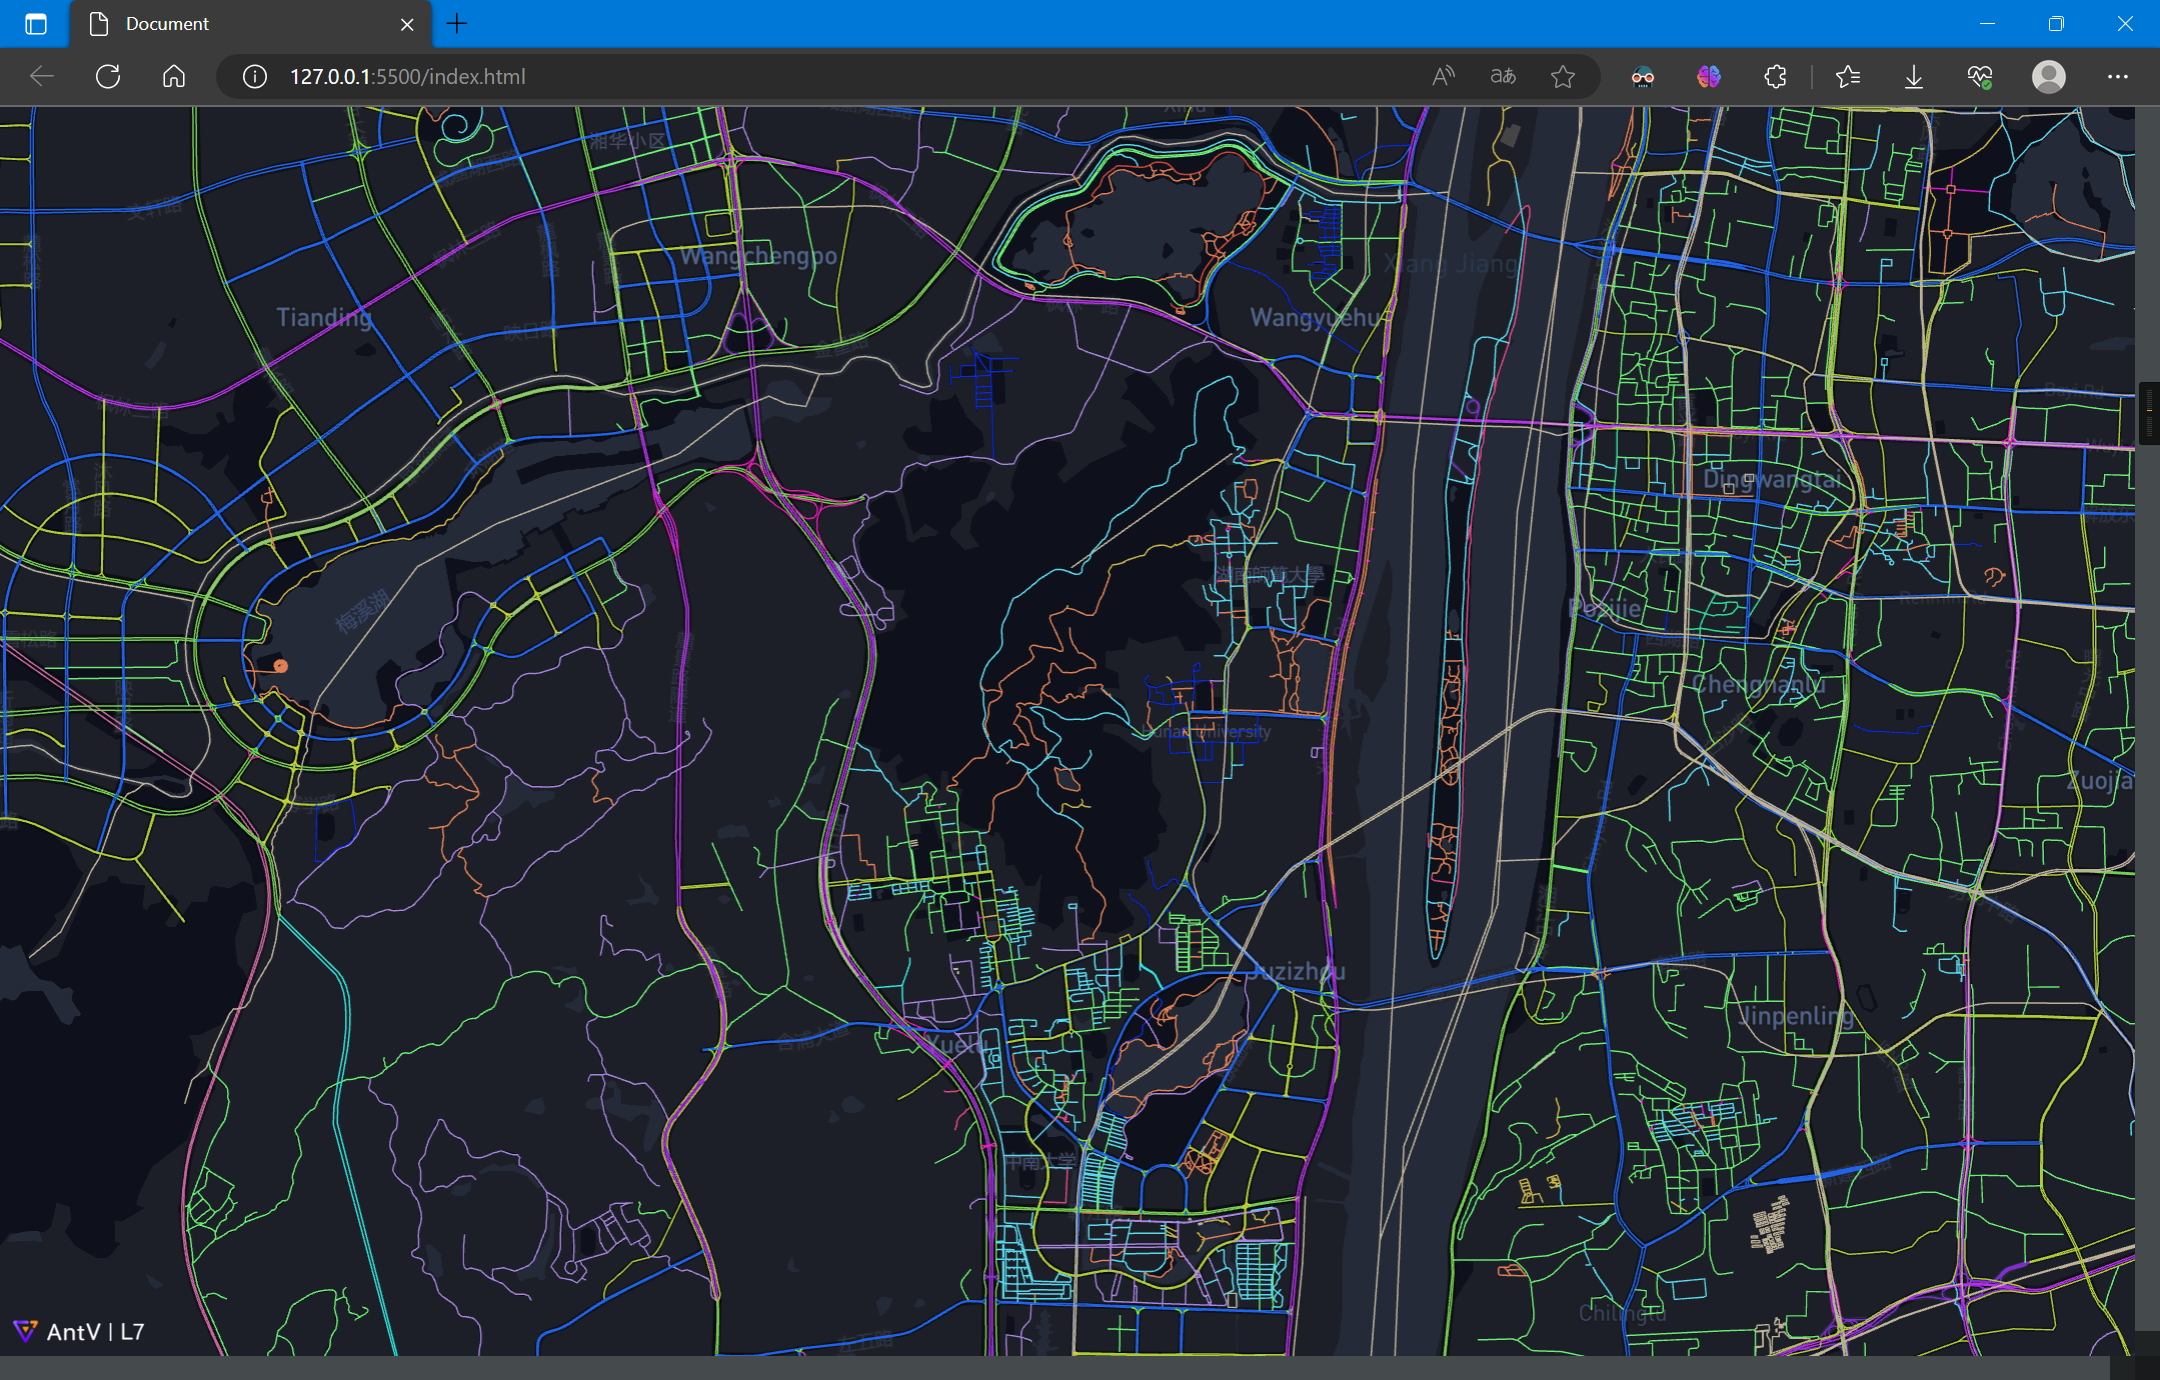
叠加图层:
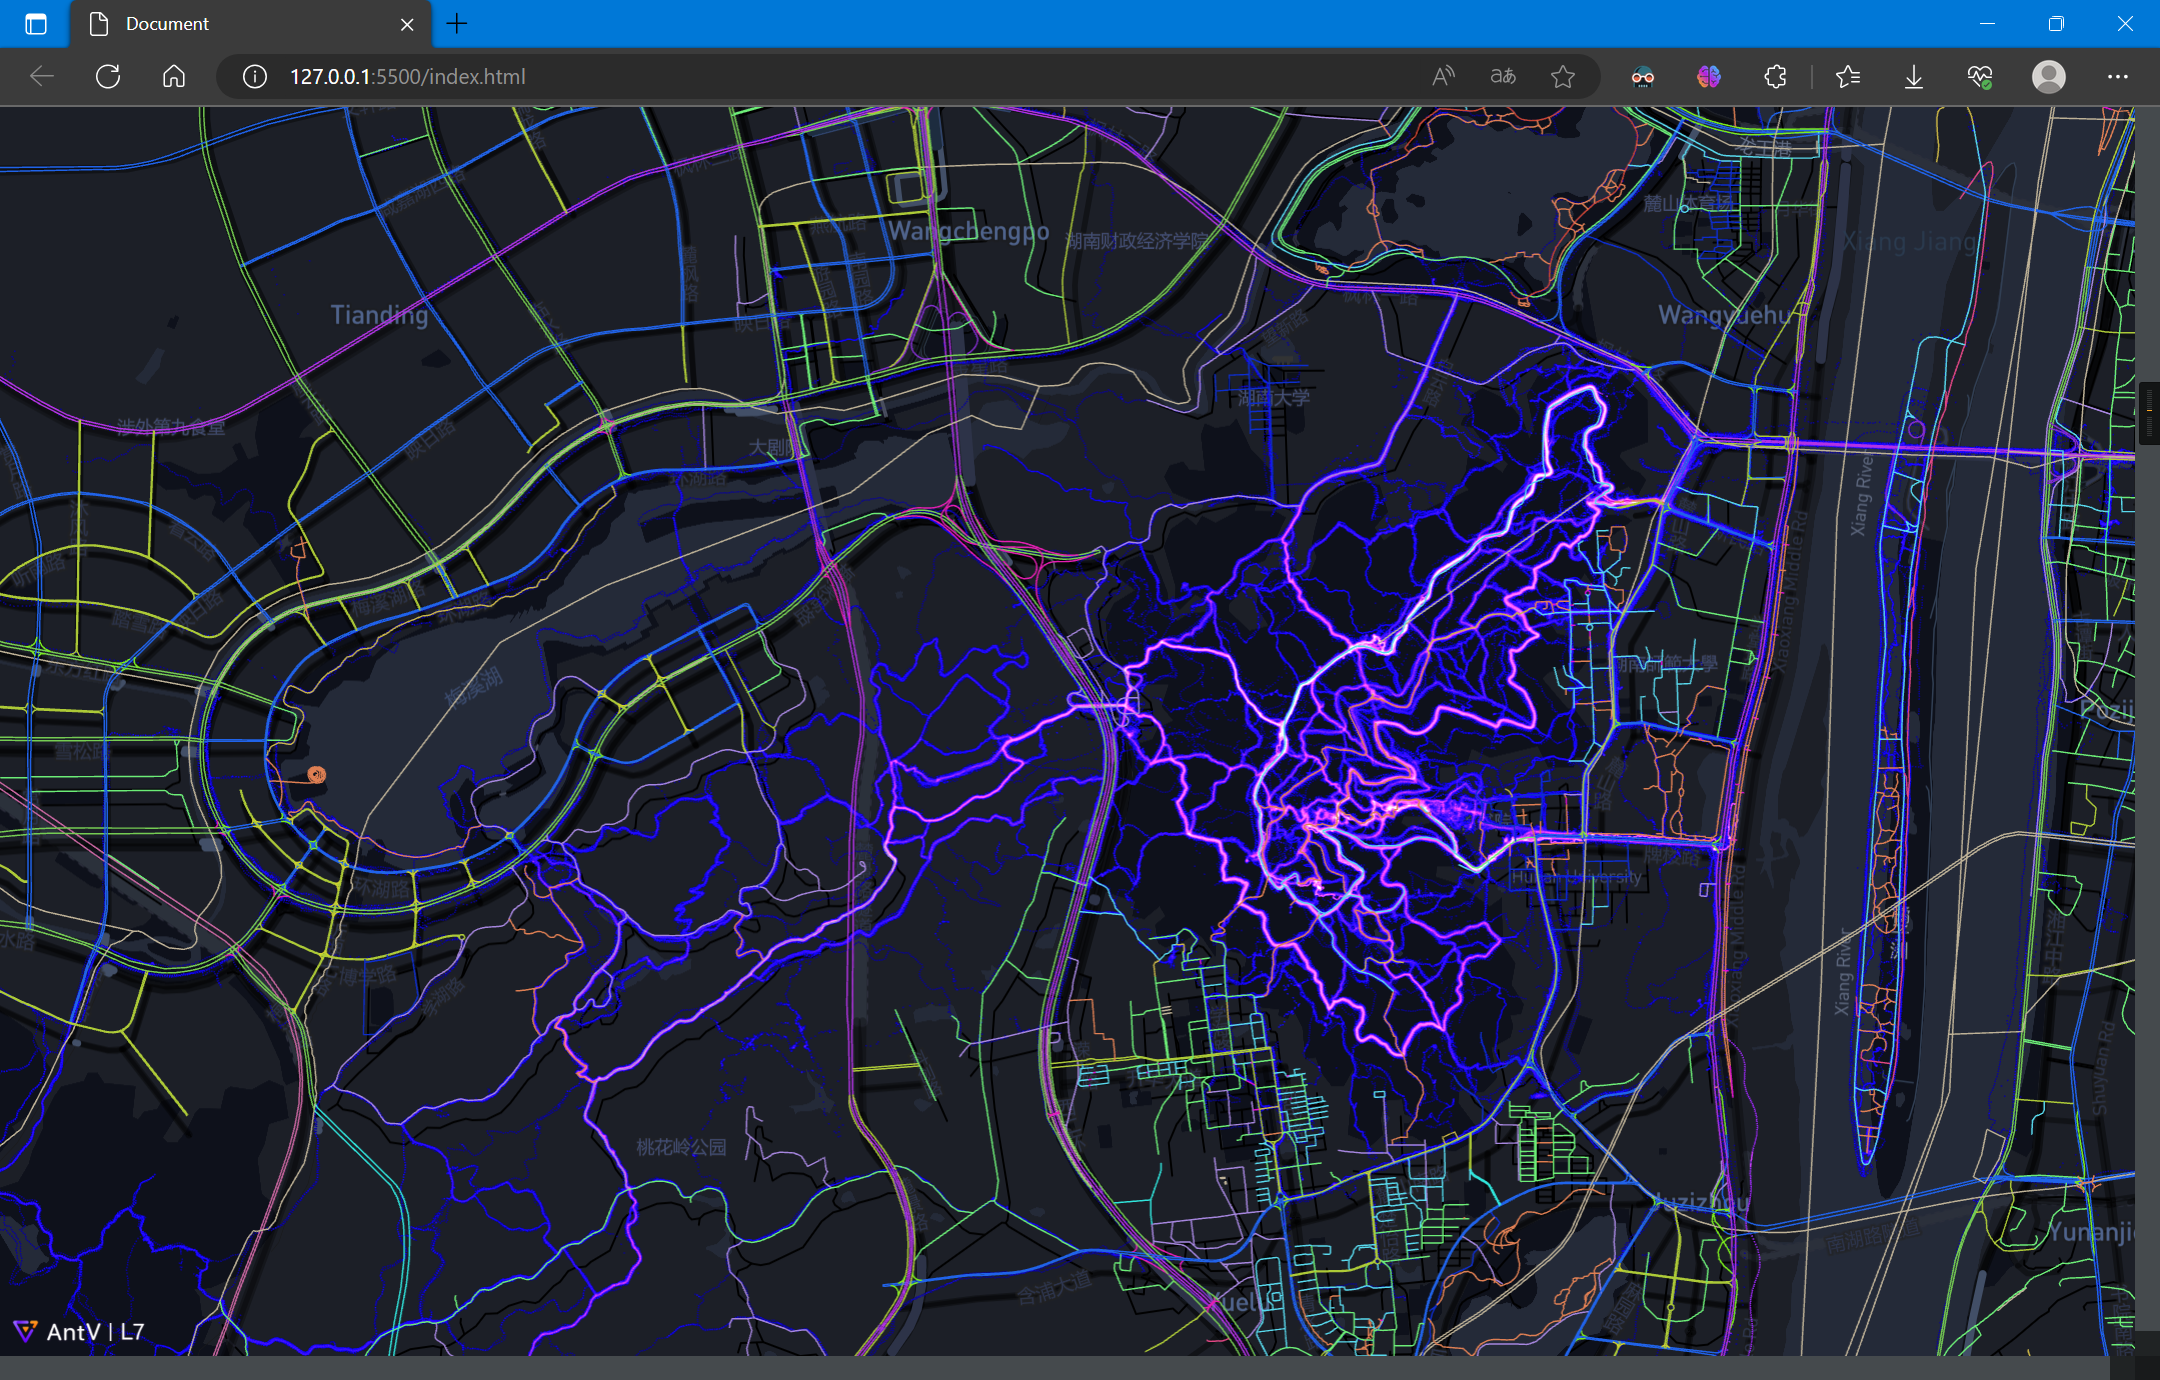
可以看到,在景区的轨迹信息比路网信息更为完善和直观
6.2.5 路网提取
从上图不难看出,虽然有的地方在路网上不显示,这些道路可能只是景区小道,但它确实也是一种特殊的道路,尤其是对于行人、旅行者而言
当足够数量的轨迹点显示在一起时,这些亮度图似乎就是路网图,更进一步的,可以从这些轨迹数据中提取去路网
这里不做具体研究阐述,可以参考下列文章:
- (PDF) 基于众源轨迹数据的行人路网提取 (researchgate.net)
- (PDF) Pedestrian network generation based on crowdsourced tracking data (researchgate.net)
- Map Inference in the Face of Noise and Disparity
- ......
这里使用的是《Map Inference in the Face of Noise and Disparity》中所提出的算法进行提取路网,并提取GPS轨迹数据中的三维信息,构建为三维路网
《Map Inference in the Face of Noise and Disparity》中所提出的算法源码可以在以下地址下载:
- haidaoxiaofei/mapinference-gis12-upgrade (github.com)
- qcri/gpsmap: Real time map creation and update using gps data (github.com)
另外,还有多种路网提取算法,可以在下列网站中查看并使用:
6.2.6 二维路网可视化
经过一系列的数据预处理、路网提取、数据后处理,从上述的轨迹数据得到了以下路网数据:
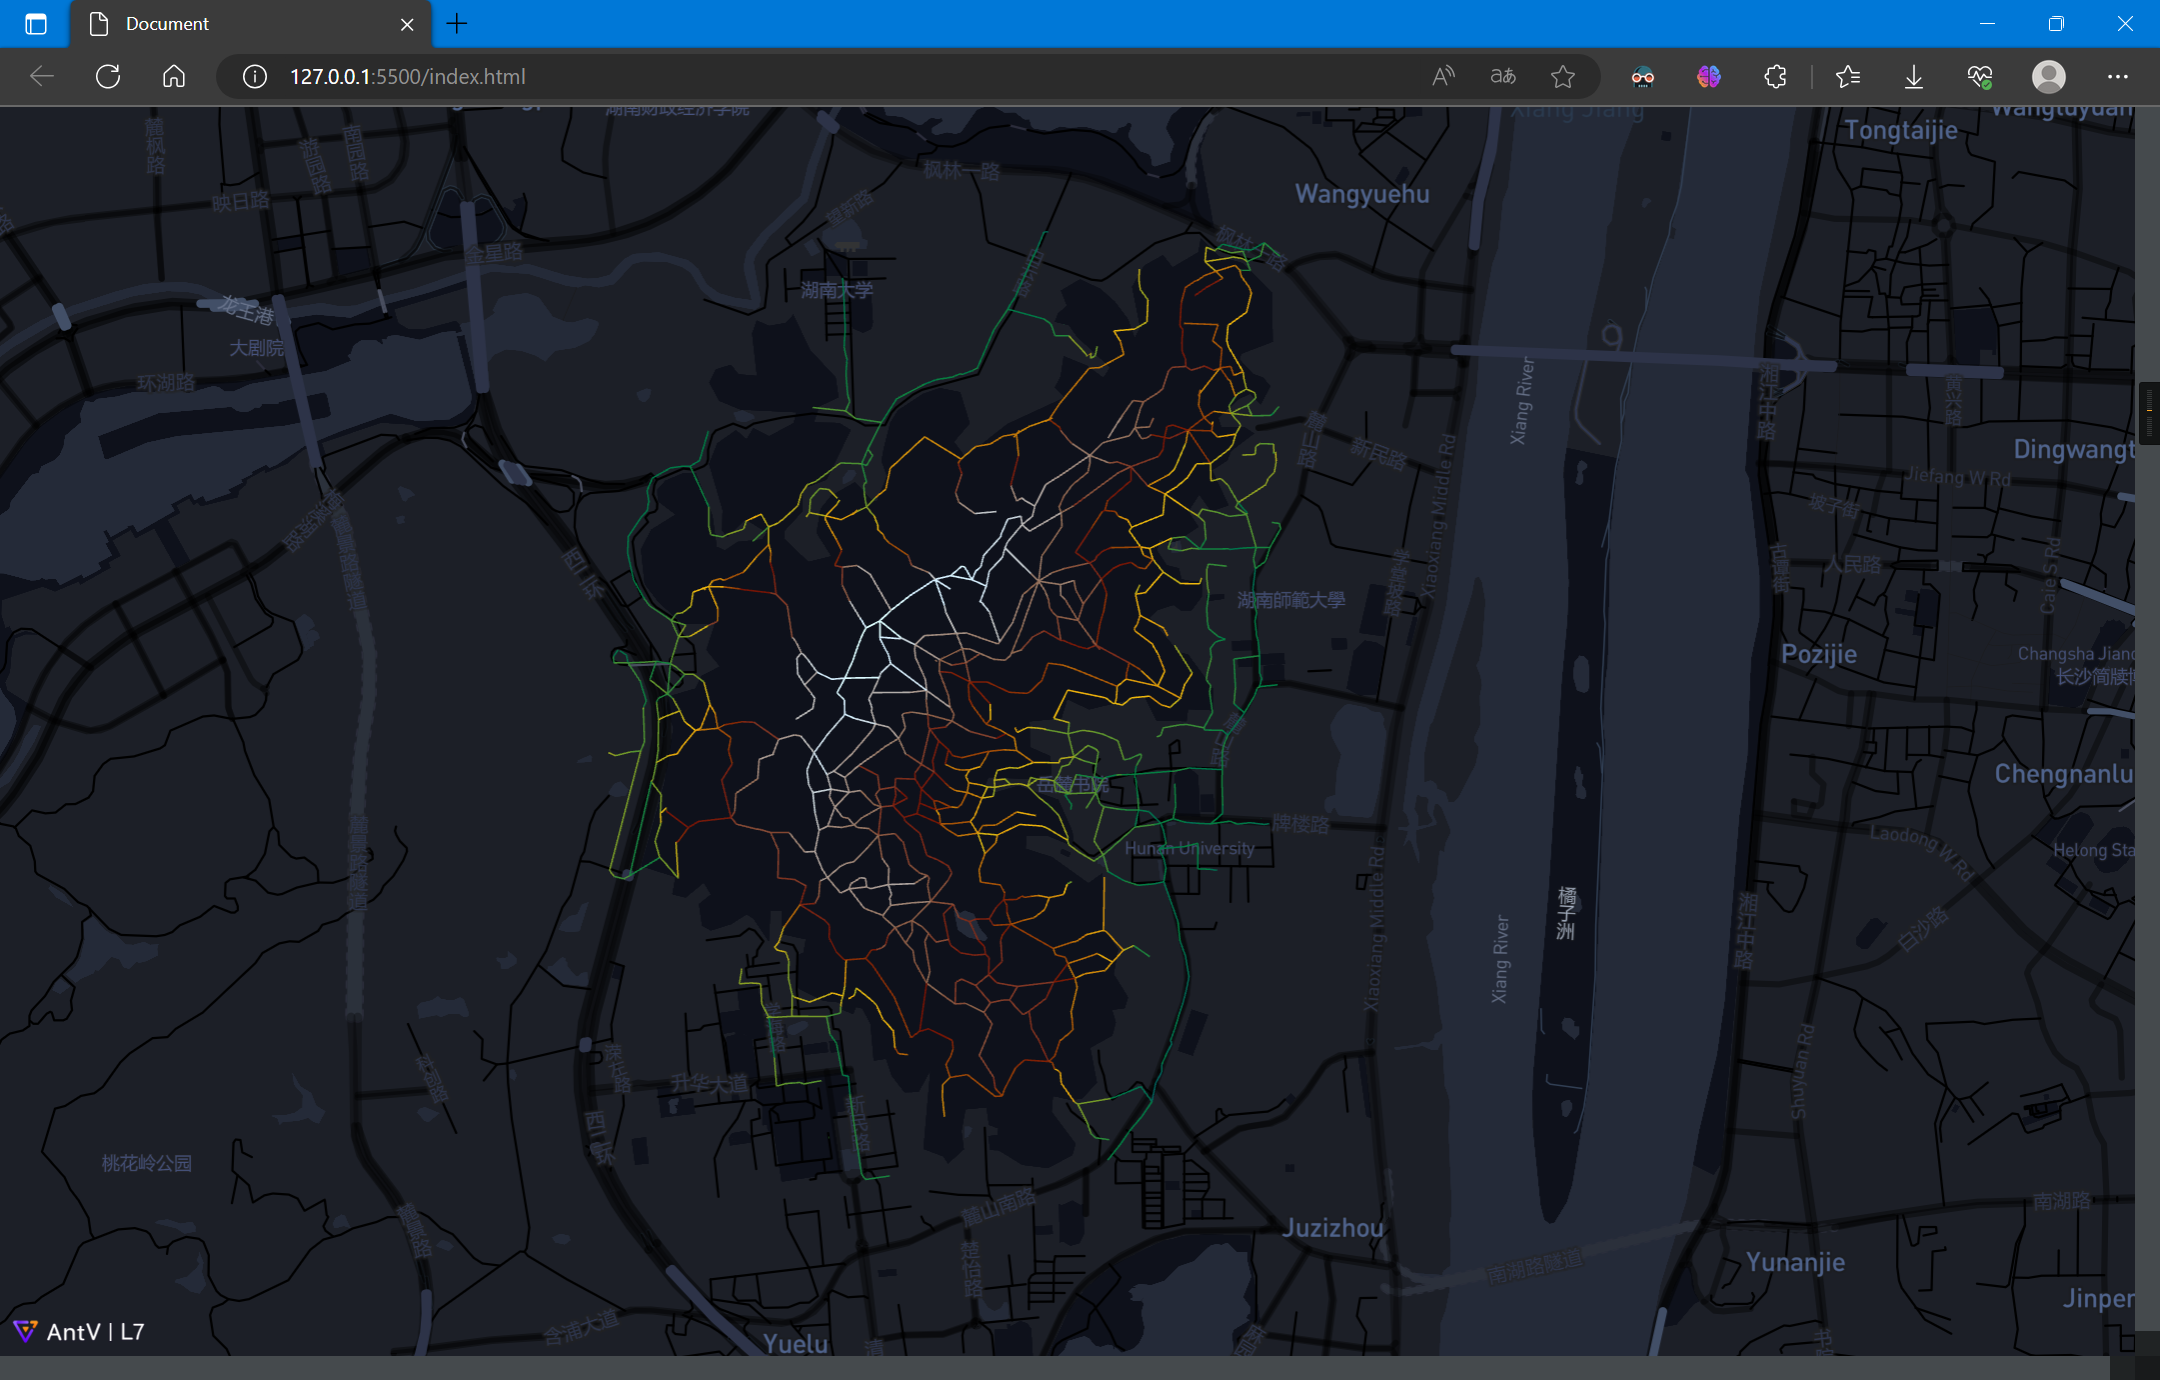
其中,海拔渐变色带由低到高为:
由图中可以看出岳麓山景点路网数据的相对高度
绘制的代码如下:
<!DOCTYPE html>
<html lang="en">

<head>
  <meta charset="UTF-8">
  <meta http-equiv="X-UA-Compatible" content="IE=edge">
  <meta name="viewport" content="width=device-width, initial-scale=1.0">
  <title>Document</title>
  <script src='https://api.mapbox.com/mapbox-gl-js/v2.15.0/mapbox-gl.js'></script>
  <link href='https://api.mapbox.com/mapbox-gl-js/v2.15.0/mapbox-gl.css' rel='stylesheet' />
  <script src='https://unpkg.com/@antv/l7'></script>
  <style>
    body,
    #map {
      height: 100vh;
      width: 100vw;
      margin: 0;
    }
  </style>
</head>

<body>
  <div id="map"></div>
  <script>
    const scene = new L7.Scene({
      id: 'map',
      map: new L7.Mapbox({
        style: 'dark',
        center: [112.9448, 28.1708],
        zoom: 12,
        token: 'pk.eyJ1IjoieWFuZ2ppYW4iLCJhIjoiY2phaG1neno0MXFkNDMzbWhwNWw0bWM4aiJ9.CFmrh0LVWAbmVeed-Xr7wA'
      })
    });

    scene.on('loaded', () => {
      fetch('./Yuelushan.geojson')
        .then(res => res.json())
        .then(data => {
          const layer = new L7.LineLayer({
            zIndex: 2,
          })
            .source(data)
            .size(0.5)
            .active(true)
            .color('z1', ['#0b8040', '#f2b90c', '#751304', '#8c644c', '#b8b8b8']);
          scene.addLayer(layer);
        });
    });

  </script>
</body>
6.2.7 三维路网可视化
路网数据的格式如下:
{
  "type": "FeatureCollection",
  "name": "Yuelushan",
  "crs": {
    "type": "name",
    "properties": {
      "name": "urn:ogc:def:crs:OGC:1.3:CRS84"
    }
  },
  "features": [
    {
      "type": "Feature",
      "properties": {
        "id": 0,
        "z1": 74.72296906,
        "z2": 74.72296906
      },
      "geometry": {
        "type": "MultiLineString",
        "coordinates": [
          [
            [
              112.918952568856085,
              28.182139289691705,
              74.72296906
            ],
            [
              112.918964283127451,
              28.182139382193309,
              74.72296906
            ]
          ]
        ]
      }
    },
    ......
由示例数据可知,每个点坐标是由经纬度和高程组成,而L7默认支持路网数据高程显示:

6.2.8 坡度信息图
利用高程信息,可以制作出坡度信息图
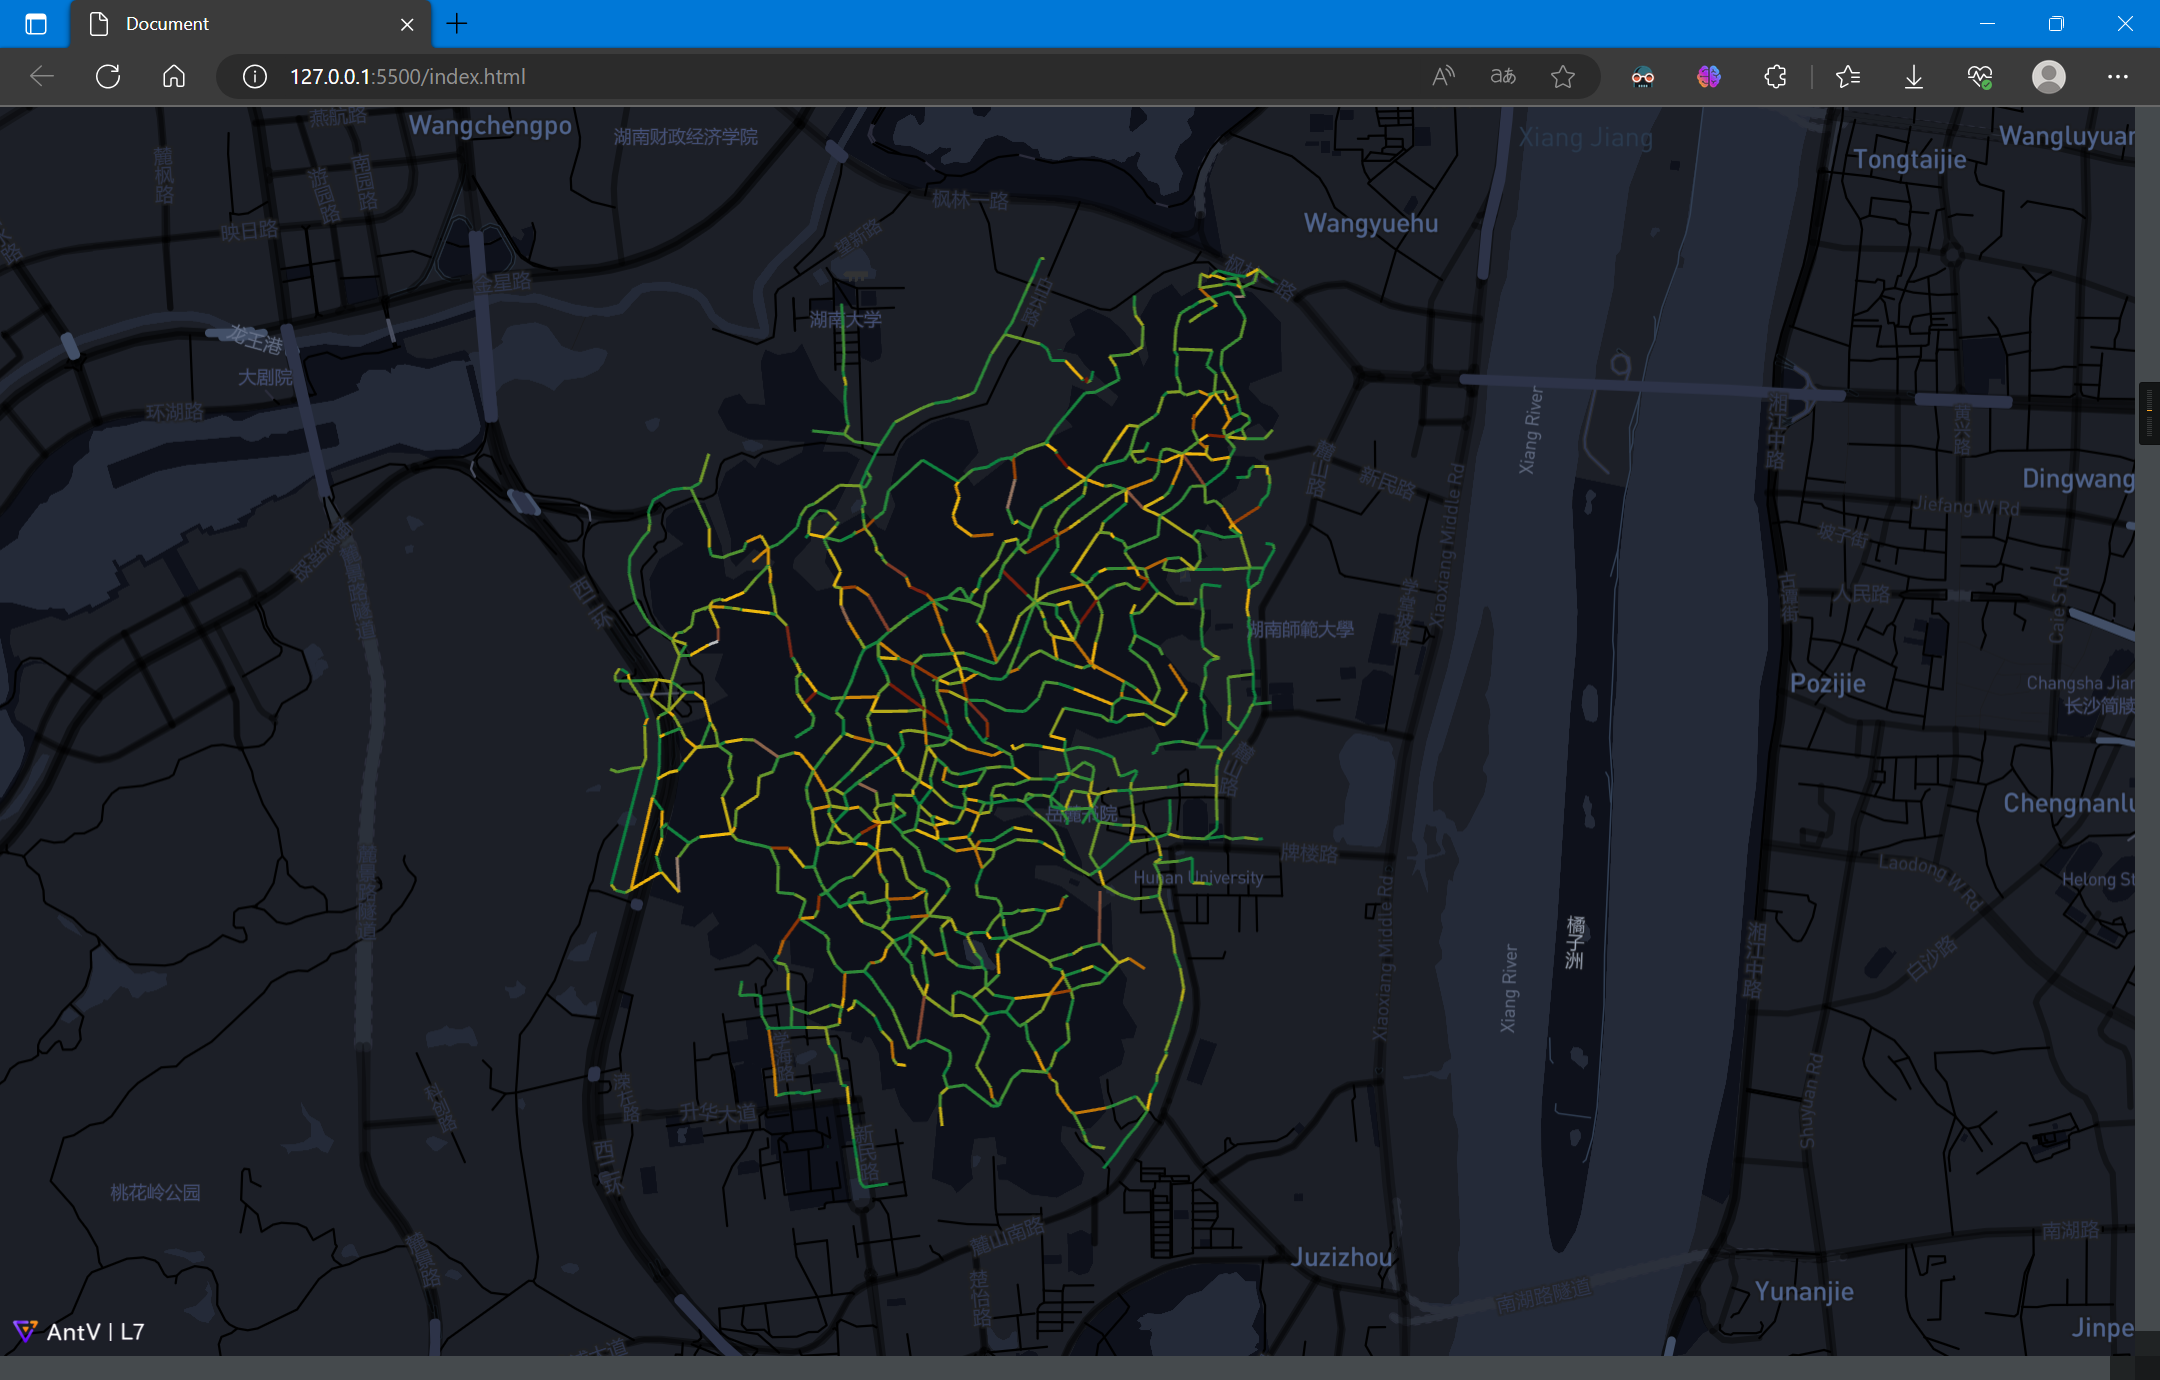
利用坡度信息,可以帮助行人选择道路,实现代码如下:
<!DOCTYPE html>
<html lang="en">

<head>
  <meta charset="UTF-8">
  <meta http-equiv="X-UA-Compatible" content="IE=edge">
  <meta name="viewport" content="width=device-width, initial-scale=1.0">
  <title>Document</title>
  <script src='https://api.mapbox.com/mapbox-gl-js/v2.15.0/mapbox-gl.js'></script>
  <link href='https://api.mapbox.com/mapbox-gl-js/v2.15.0/mapbox-gl.css' rel='stylesheet' />
  <script src='https://unpkg.com/@antv/l7'></script>
  <style>
    body,
    #map {
      height: 100vh;
      width: 100vw;
      margin: 0;
    }
  </style>
</head>

<body>
  <div id="map"></div>
  <script>
    const scene = new L7.Scene({
      id: 'map',
      map: new L7.Mapbox({
        style: 'dark',
        center: [112.9448, 28.1708],
        zoom: 12,
        token: 'pk.eyJ1IjoieWFuZ2ppYW4iLCJhIjoiY2phaG1neno0MXFkNDMzbWhwNWw0bWM4aiJ9.CFmrh0LVWAbmVeed-Xr7wA'
      })
    });

    scene.on('loaded', () => {
      fetch('./Yuelushan.geojson')
        .then(res => res.json())
        .then(data => {
          data.features.forEach(element => {
            element.properties.slope = Math.abs(element.properties.z1 - element.properties.z2);
          });
          const layer = new L7.LineLayer({
            zIndex: 2,
          })
            .source(data)
            .size(1)
            .active(true)
            .color('slope', ['#0b8040', '#f2b90c', '#751304', '#8c644c', '#b8b8b8']);
          scene.addLayer(layer);
        });
    });

  </script>
</body>
注:此处坡度计算并不准确,只是大致示意
7. 总结与感悟
笔者使用过多个Web端的GIS开源库,包括OpenLayers、Leaflet、Mapbox、Cesium等,也使用过ECharts等图表库,相较而言,L7开箱即用的特点十分突出,基于WebGL的渲染方式在面对地理大数据时也能获得不错的体验,甚至在上述的案例中,绘制轨迹数据的流畅感比C++写的桌面端软件的QGIS更好
不足之处是,和老牌的GIS开源库相比,专业性和可配置性还是有所欠缺,三维方面也有待完善。当然,目前看来,L7的主要应用场景的地理数据可视化,如果是侧重地理可视化的项目与应用场景,L7是个非常不错的选择
8. 参考资料
[3] 场景 Scene | L7 (antgroup.com)

 这是一篇由浅入深的AntV L7的学习笔记总结