1、概述
最近因项目需要统计服务的负载情况及机器的负载情况,但是项目里面却没有相关统计而服务所在的机器也没有相关的监控,因为工期原因就选择了相对轻量级的prometheus方案。其中windows_exporter用来采集机器的负载情况,如CPU、内存、磁盘io、网络等基础信息,使用mtail来采集应用日志统计服务情况(需要业务系统有基础的日志,如请求发起,是否正常结束等,或者通过nginx等中间件的日志来统计也行),如QPS、TPS、请求数、成功率、异常率等,使用prometheus来统计分析相应的指标及设置报警规则等,如通过请求总数来计算QPS等。
2、windows_exporter配置启动
建议下载最新版本,最新版本下载地址
,我下载的版本为windows_exporter-0.18.1-386.exe,将其解压到任意目录下,进入将其在后台启动:
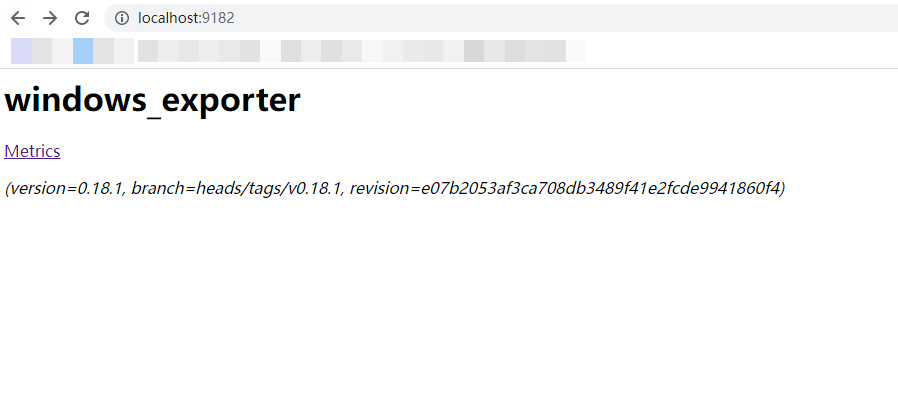
其中链接Metrics为采集到的指标(metrics)如下:

3.mtail配置启动
mtail是谷歌基于golang开发的一款日志收集工具,用于从应用程序日志中提取白盒监视数据以收集在时间序列数据库中。
建议下载最新版本,最新版下载地址请戳此处,我下载的版本为mtail_3.0.0-rc48_Linux_arm64.tar.gz,此版本是可执行二进制文件,移动至/usr/local/sbin下即可使用。
查看mtail版本(验证matail命令是否可用):
mtail -version
输出如下:
mtail version 3.0.0-rc48 git revision e19766e45ca2dedf34794fea51444c7963a7c3d6 go version go1.17.5 go arch 386 go os linux
mtail启动命令如下:
nohup mtail -port 8080 -logtostderr -progs /etc/mtail/access.mtail -logs /xxx/xxx.log ᾐ端口可以自定义,也可同时启动多个mtail监控多个日志文件。
-progs参数需要以.mtail结尾,脚本内容为需要从日志中提取的指标,具体格式脚本写法及例子请参考此链接。
例子中access.mtail的内容如下:
counter apache_http_requests_total by request_method, http_version, status_codecounter apache_http_bytes_total by request_method, http_version, status_codegauge apache_http_response_time by remote_host, request_method, request_uri, status_codegauge apache_http_response_size by remote_host, request_method, request_uri, status_code histogram apache_http_request_time_millseconds_bucket buckets 0, 1, 2, 4, 8 by status_code /^/ +/(?P<remote_host>[0-9A-Za-z\.:-]+) / + # %h/(?P<remote_logname>[0-9A-Za-z-]+) / + # %l/(?P<remote_username>[0-9A-Za-z-]+) / + # %u/\[(?P<timestamp>\d{2}\/\w{3}\/\d{4}:\d{2}:\d{2}:\d{2} (\+|-)\d{4})\] / + # %u/"(?P<request_method>[A-Z]+) (?P<request_uri>\S+) (?P<http_version>HTTP\/[0-9\.]+)" / + # \"%r\"/(?P<status_code>\d{3}) / + # %>s/((?P<response_size>\d+)|-) / + # %b/(?P<response_time>\d+) / + # %D/"(?P<referer>\S+)" / + # \"%{Referer}i\"/"(?P<user_agent>[[:print:]]+)"/ + # \"%{User-agent}i\"/$/ { strptime($timestamp, "02/Jan/2006:15:04:05 -0700") apache_http_requests_total[$request_method][$http_version][$status_code]++ $response_size > 0 { apache_http_bytes_total[$request_method][$http_version][$status_code] += $response_size apache_http_response_size[$remote_host][$request_method][$request_uri][$status_code] += $response_size } apache_http_response_time[$remote_host][$request_method][$request_uri][$status_code] = $response_time apache_http_request_time_millseconds_bucket[$status_code] = $response_time} getfilename() !~ /access_log.?log/ { stop}
counter media_request_total/receive http request path is/ {  media_request_total++}
#第一段代码是监控apache日志,第一阶段测试可用此段配置。
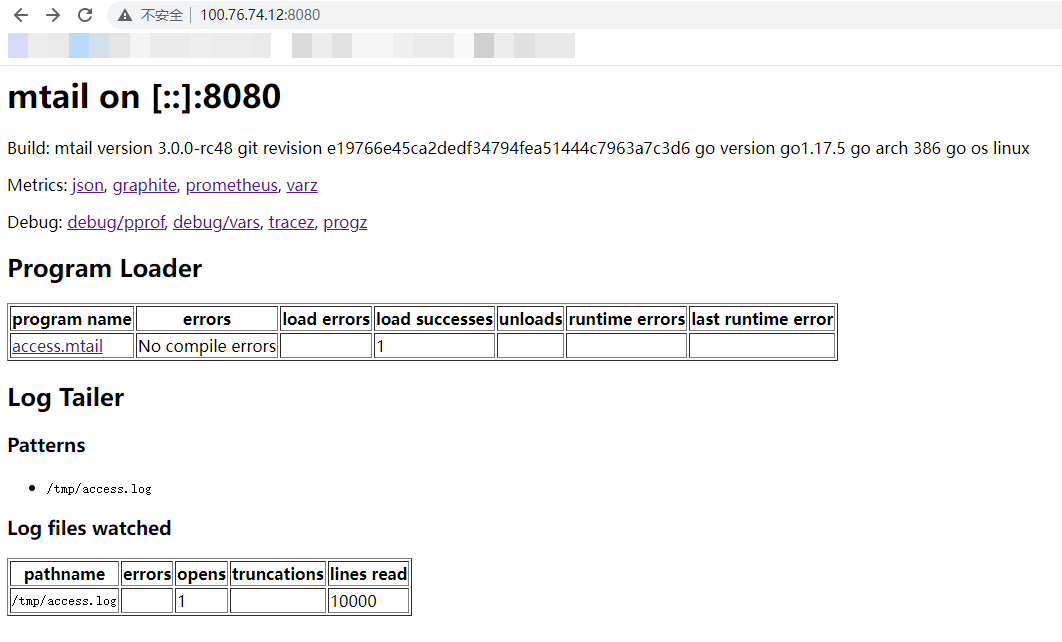
查看mtail信息,访问http://ip:3903:
这里需要注意的是:若监控apache日志,需配置好第一段代码运行后触发apache(重启)产生新日志才能被监控到。
4.prometheus配置启动
建议下载最新版本,最新版下载地址请戳此处,我下载的版本为prometheus-2.34.0.windows-amd64.zip,将其解压到任意目录下,进入目录修改配置文件prometheus.yml添加windows_exporter和matail 的采集路径,prometheus.yml文件配置如下:
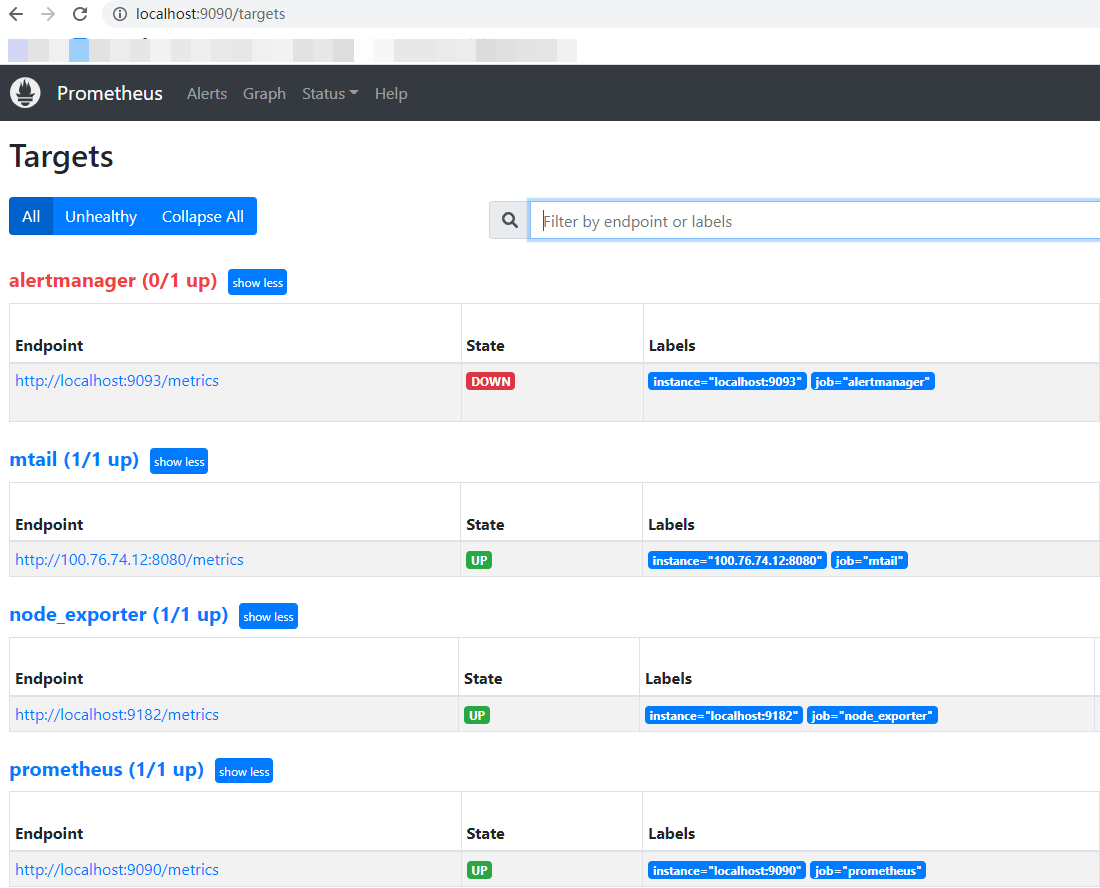
# my global configglobal: scrape_interval: 15s # Set the scrape interval to every 15 seconds. Default is every 1 minute. evaluation_interval: 15s # Evaluate rules every 15 seconds. The default is every 1 minute. # scrape_timeout is set to the global default (10s).# Alertmanager configurationalerting: alertmanagers: - static_configs: - targets: - alertmanager:9093# Load rules once and periodically evaluate them according to the global 'evaluation_interval'.rule_files: - "rules/*_rules.yml" #告警规则yml文件 # - "second_rules.yml"# A scrape configuration containing exactly one endpoint to scrape:# Here it's Prometheus itself.scrape_configs: # The job name is added as a label `job=<job_name>` to any timeseries scraped from this config. - job_name: "prometheus" # metrics_path defaults to '/metrics' # scheme defaults to 'http'. static_configs: - targets: ["localhost:9090"] - job_name: "node_exporter" scrape_interval: 5s #每五秒检查一次应用进程 metrics_path: "/metrics" #指标路径 static_configs: - targets: ["localhost:9182"] - job_name: "alertmanager" scrape_interval: 5s static_configs: - targets: ["localhost:9093"] - job_name: "mtail" scrape_interval: 5s static_configs: - targets: ["xx.xx.xx.xx:8080"]
prometheus默认端口为9090,通过网页访问http://ip:9090/:
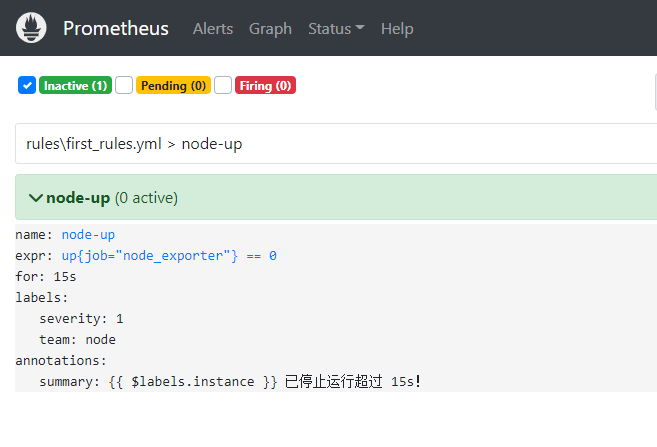
如需配置告警,需在目录下新建rules文件夹,告警配置如下:
groups:- name: node-up # 分组名称 rules: # 规则设置 - alert: node-up #告警名称 expr: up{job="windows_exporter"} == 0 # 表达式,查询式语句查询up的值是否等于0,如果等于则告警 for: 15s # 告警持续时间 labels: severity: 1 team: node annotations: # 注解 summary: "{{ $labels.instance }} 已停止运行超过 15s!"
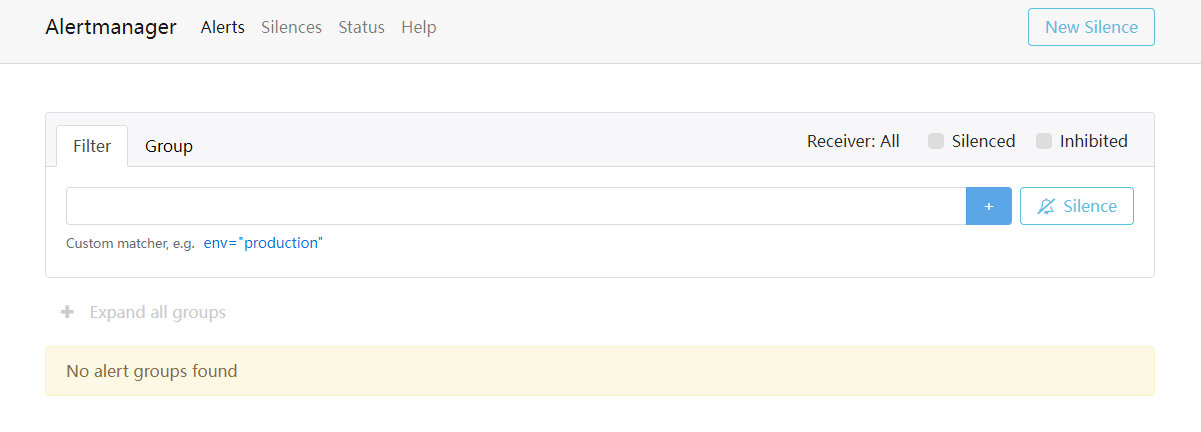
5、alertmanager配置
建议下载最新版本,最新版下载地址请戳此处,Alertmanager的配置有两个地方,一个是在Prometheus server端进行配置告警节点,指定匹配告警规则文件路径,以及监控alertmanager本身。另一个直接配置alertmanager自身的配置,在alertmanager.yml进行配置。
global: resolve_timeout: 5m smtp_smarthost: 'smtp.qq.com:465' smtp_from: 'xxxxxxxxx@qq.com' smtp_auth_username: 'xxxxxxxxx@qq.com' smtp_auth_password: 'xxxxxxxxx' # 16位qq邮箱授权码作为密码 smtp_require_tls: falseroute: group_by: ['alertname'] group_wait: 10s group_interval: 10s repeat_interval: 1h receiver: 'email' # 选用邮箱告警发送receivers:- name: 'email' email_configs: - to: 'xxxxxxxxx@qq.com'inhibit_rules: - source_match: severity: 'critical' target_match: severity: 'warning' equal: ['alertname', 'dev', 'instance']
6.总结
此套监控的解决方案优点在于完全对业务系统解耦,并且对业务系统透明,唯一需要的就是业务系统的日志所在路径。
而此套系统的关键点在于mtail脚本编写和mtail采集到的数据最终使用promQL分析,mtail脚本需要知道业务系统的日志是否满足监控系统的需求,如果不满足还是需要改动业务代码添加相应的日志。而promQL则需要掌握相关的语法规则及内置函数,只要掌握了这两个关键点,整套系统就搞定了。
转载请声明出处哦~,本篇文章发布于Biuget-Golang的博客:
https://www.cnblogs.com/Biuget-Golang/