其他章节请看:
react实战 系列
上一篇我们在 spug 项目中模仿”任务计划“模块实现一个类似的一级导航页面(”My任务计划“),本篇,我们将模仿“Dashboard”来实现一个仪表盘“My Dashboard”。
主要涉及 antd 的 Grid、Card、Descriptions等组件、bizcharts 的使用、moment 日期库和页面适配。
注:实现的代码在上一篇的基础上展开。
界面如下: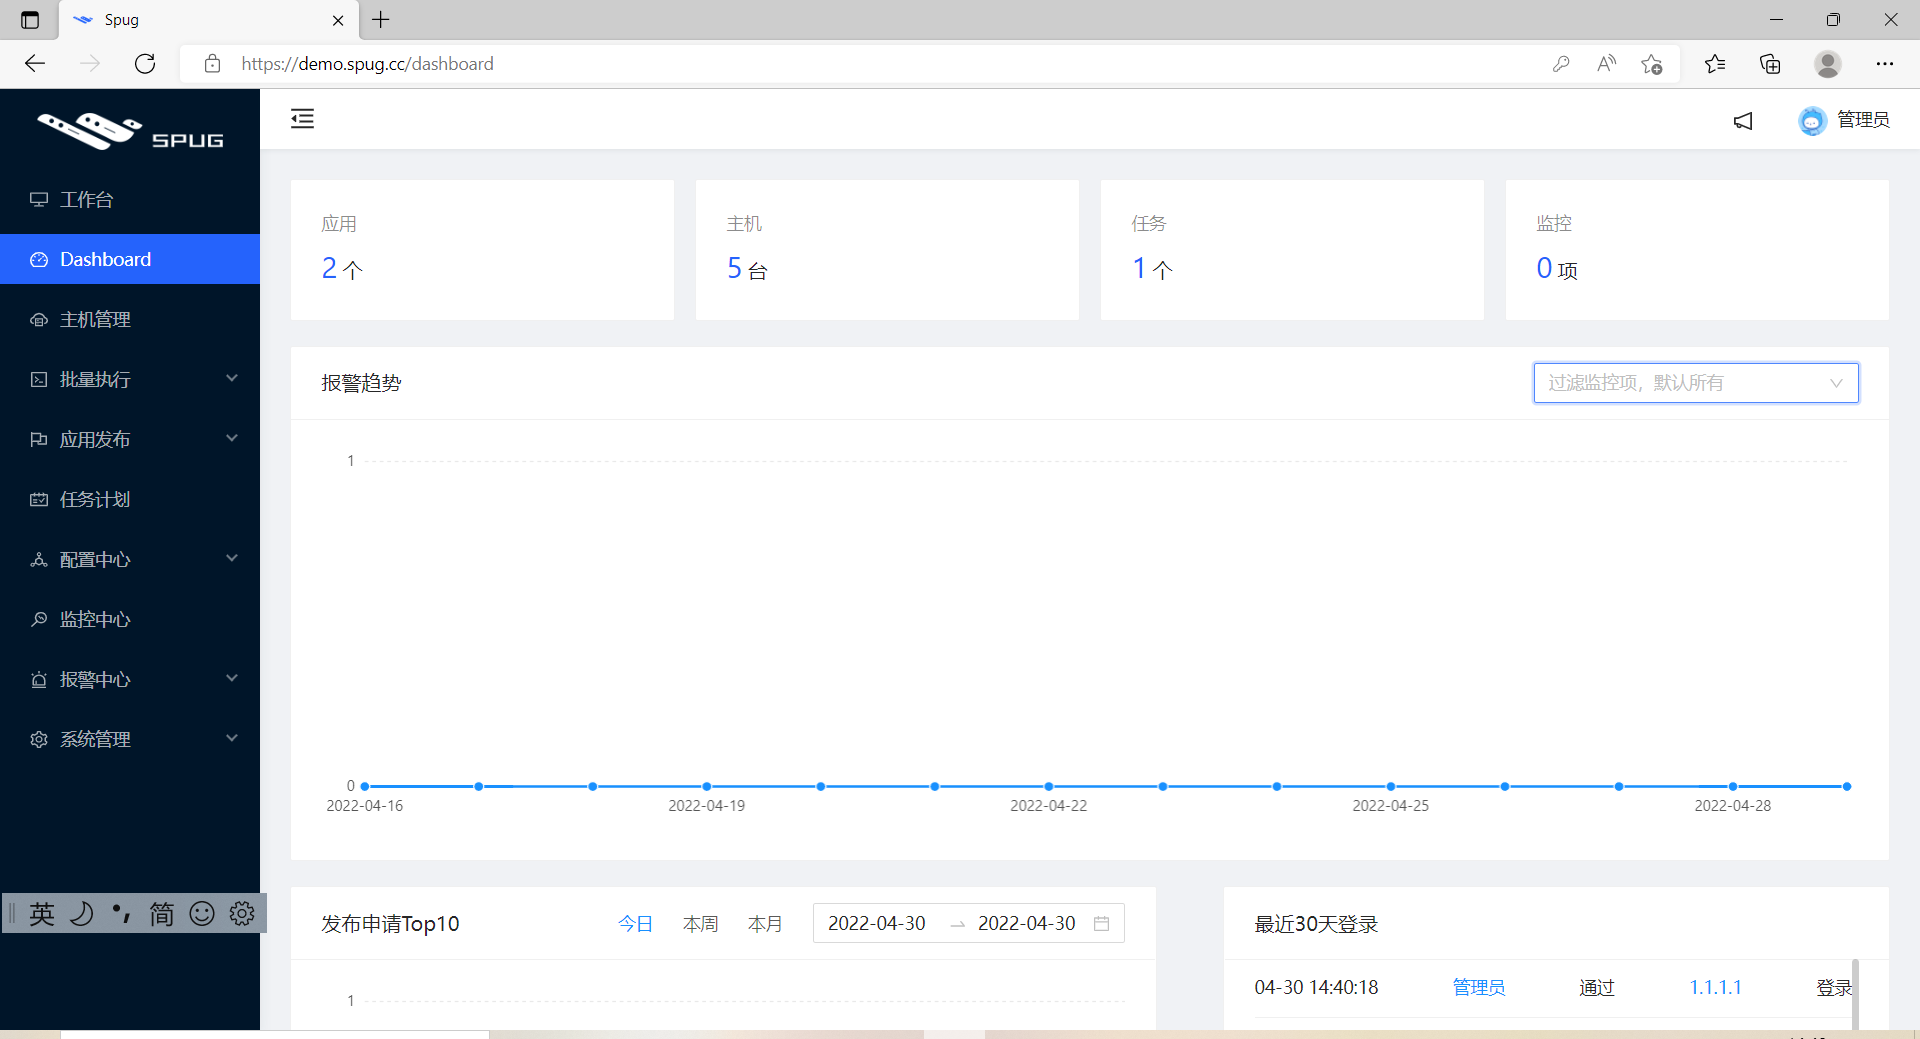
里面用到了:
Grid、Card、Descriptions 描述列表 (文字长度不同,有时会感觉没对齐)bizcharts 中的折线图、柱状图moment(日期相关的库),比如按天、按月、最近 30 天都很方便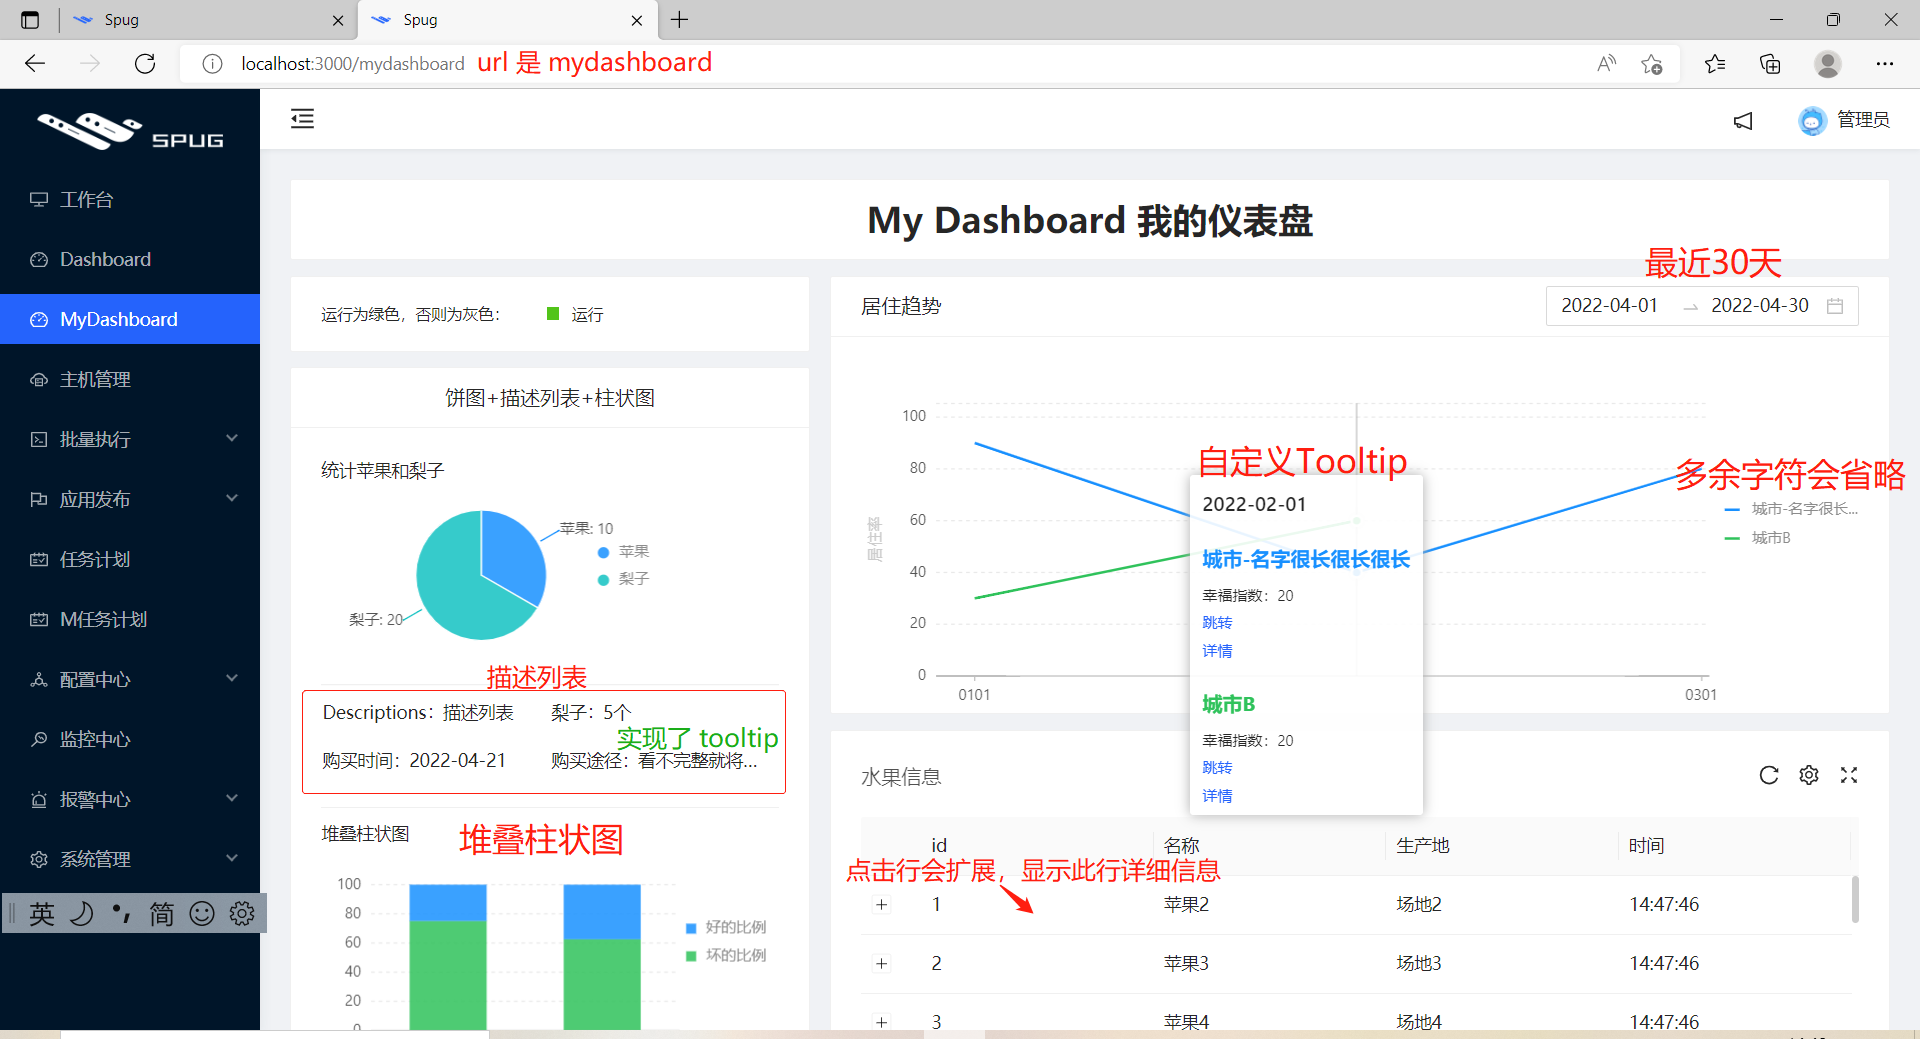
无需权限即可访问: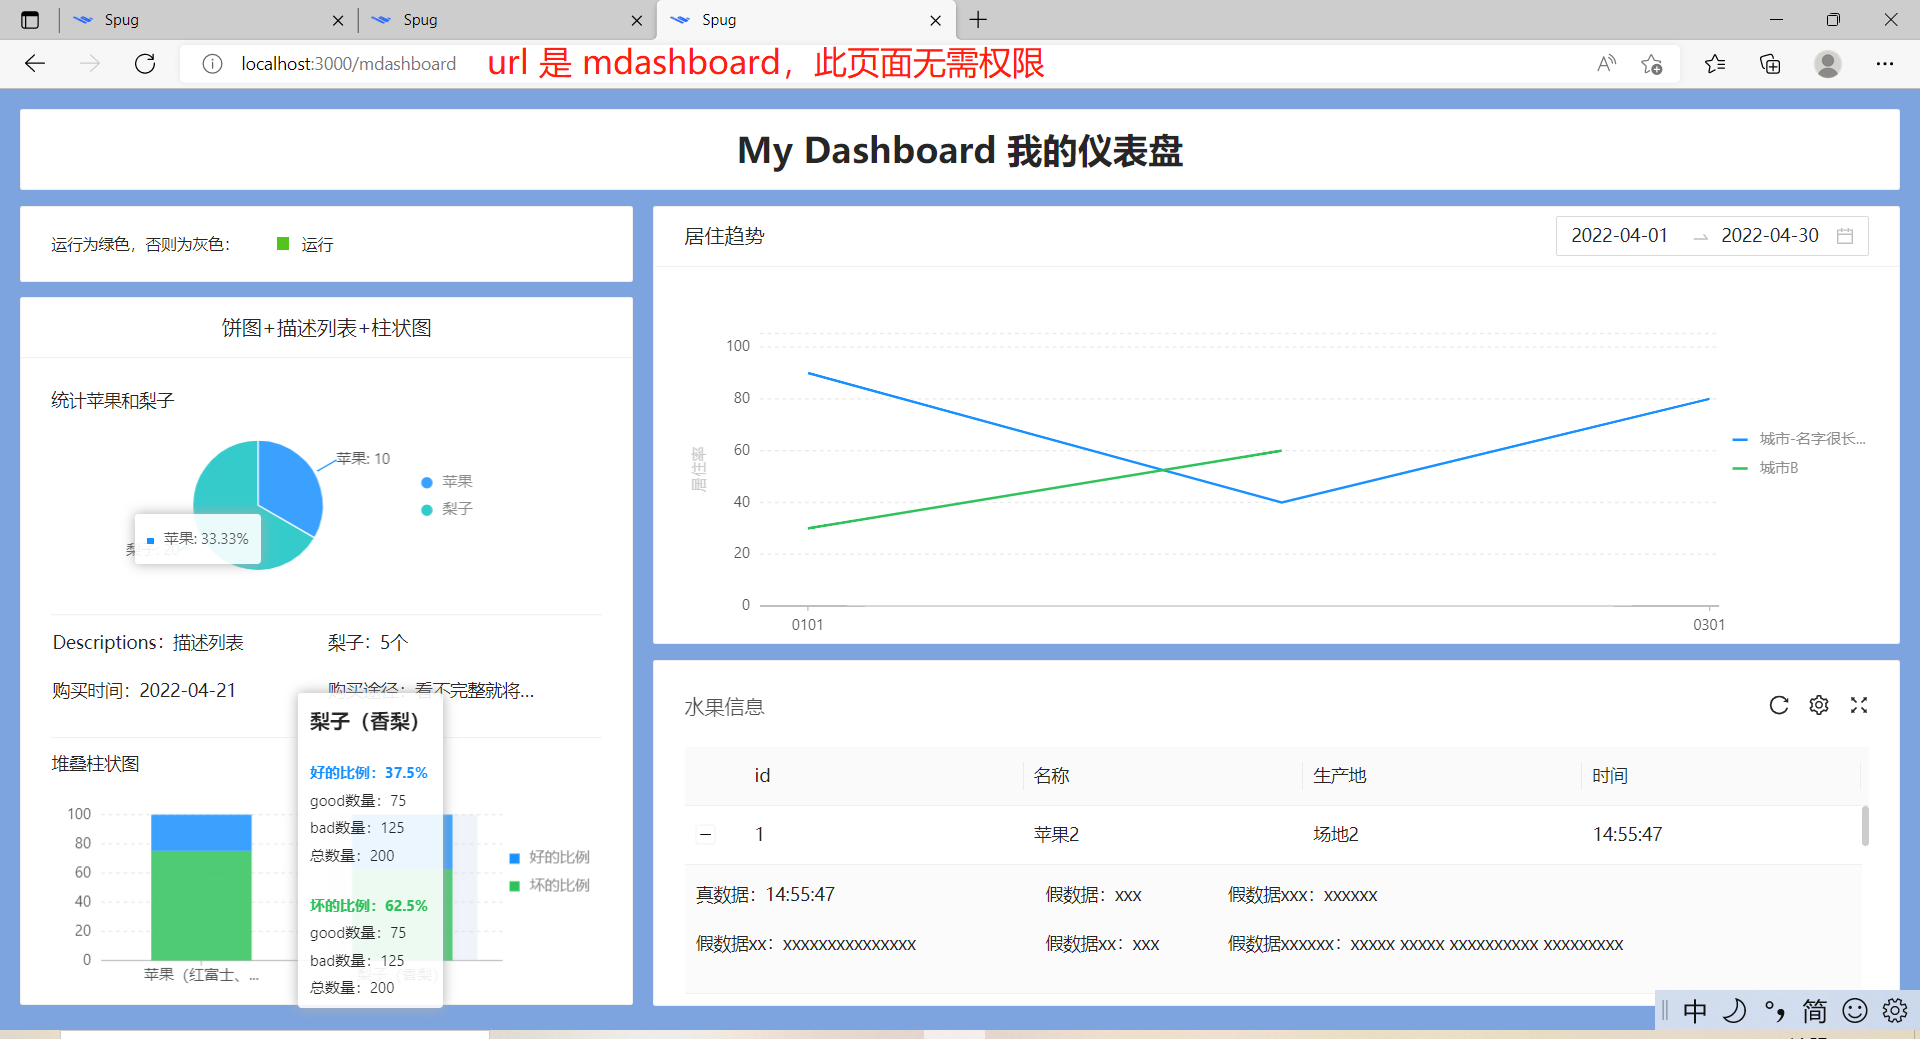
全屏效果: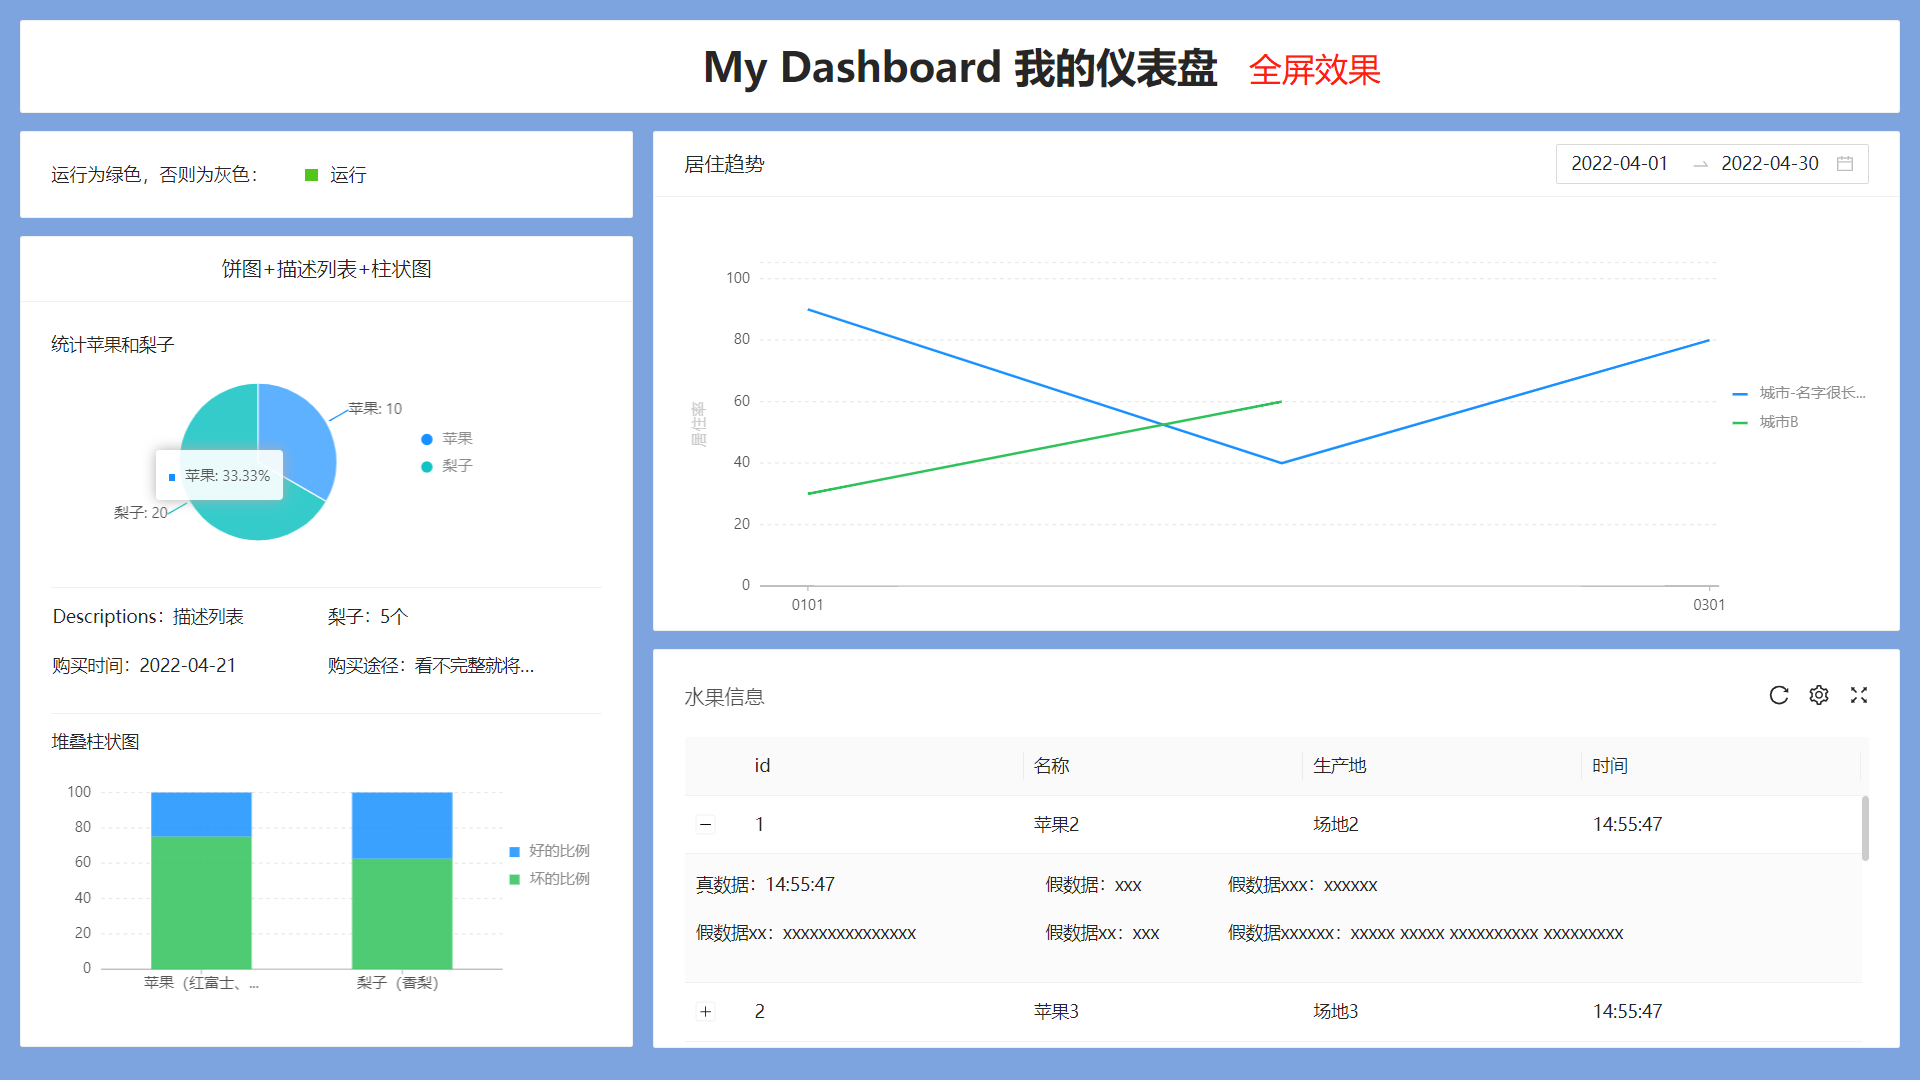
@antv/data-set,柱状图和饼状图需要使用bx-tooltip,自定义 bizcharts 中的 tooltip。折线图和柱状图的 tooltip 都使用了。spug-study> npm i @antv/data-setadded 31 packages, and audited 1820 packages in 26s107 packages are looking for funding run `npm fund` for details33 vulnerabilities (1 low, 16 moderate, 15 high, 1 critical)To address issues that do not require attention, run: npm audit fixTo address all issues (including breaking changes), run: npm audit fix --forceRun `npm audit` for details.spug-study> npm i -D bx-tooltipadded 1 package, and audited 1821 packages in 9s107 packages are looking for funding run `npm fund` for details33 vulnerabilities (1 low, 16 moderate, 15 high, 1 critical)To address issues that do not require attention, run: npm audit fixTo address all issues (including breaking changes), run: npm audit fix --forceRun `npm audit` for details.package.json 变动如下:
"dependencies": { "@antv/data-set": "^0.11.8",}"devDependencies": { "bx-tooltip": "^0.1.6",}spug 中封装的表格组件,不支持 style和 size。替换一行,以及增加一行:
// src/components/TableCard.js- <div ref={rootRef} className={styles.tableCard}>+ <div ref={rootRef} className={styles.tableCard} style={{...props.customStyles}}><Table+ size={props.size}将 mydashboard 模块的的 mock 专门放入一个文件,并在 mock/index.js 中引入。
// src\mock\index.js+ import './mydashboard'// src\mock\mydashboard.jsimport Mock from 'mockjs'// 开发环境引入 mockif (process.env.NODE_ENV === 'development') { Mock.mock('/api/mdashboard/occupancy_rate/', 'get', () => ( {"data": [ { month: "2022-01-01", city: "城市-名字很长很长很长", happiness: 10, per: 90, msg1: '信息xxx' }, { month: "2022-01-01", city: "城市B", per: 30, happiness: 50, msg1: '信息xxx' }, { month: "2022-02-01", city: "城市-名字很长很长很长", happiness: 20, per: 40, msg1: '信息xxx' }, { month: "2022-02-01", city: "城市B", happiness: 20, per: 60, msg1: '信息xxx' }, { month: "2022-03-01", city: "城市-名字很长很长很长", happiness: 30, per: 80, msg1: '信息xxx' },], "error": ""}))let mIdSeed = 1;Mock.mock('/api/mdashboard/table', 'get', () => ({ "data": [{ "id": mIdSeed++, "name": "苹果" + mIdSeed, address: '场地' +mIdSeed, time: new Date().toLocaleTimeString() }, { "id": mIdSeed++, "name": "苹果" + mIdSeed, address: '场地' +mIdSeed, time: new Date().toLocaleTimeString() }, { "id": mIdSeed++, "name": "苹果" + mIdSeed, address: '场地' +mIdSeed, time: new Date().toLocaleTimeString() }, { "id": mIdSeed++, "name": "苹果" + mIdSeed, address: '场地' +mIdSeed, time: new Date().toLocaleTimeString() }, { "id": mIdSeed++, "name": "苹果" + mIdSeed, address: '场地' +mIdSeed, time: new Date().toLocaleTimeString() }, { "id": mIdSeed++, "name": "苹果" + mIdSeed, address: '场地' +mIdSeed, time: new Date().toLocaleTimeString() }, { "id": mIdSeed++, "name": "苹果" + mIdSeed, address: '场地' +mIdSeed, time: new Date().toLocaleTimeString() }, { "id": mIdSeed++, "name": "苹果" + mIdSeed, address: '场地' +mIdSeed, time: new Date().toLocaleTimeString() }, { "id": mIdSeed++, "name": "苹果" + mIdSeed, address: '场地' +mIdSeed, time: new Date().toLocaleTimeString() }, { "id": mIdSeed++, "name": "苹果" + mIdSeed, address: '场地' +mIdSeed, time: new Date().toLocaleTimeString() }, { "id": mIdSeed++, "name": "苹果" + mIdSeed, address: '场地' +mIdSeed, time: new Date().toLocaleTimeString() }, { "id": mIdSeed++, "name": "苹果" + mIdSeed, address: '场地' +mIdSeed, time: new Date().toLocaleTimeString() }, { "id": mIdSeed++, "name": "苹果" + mIdSeed, address: '场地' +mIdSeed, time: new Date().toLocaleTimeString() }, { "id": mIdSeed++, "name": "苹果" + mIdSeed, address: '场地' +mIdSeed, time: new Date().toLocaleTimeString() },]}))}配置 /mdashboard 和 /mydashboard 两个路由:
// src\App.js+ import MDashboard from './pages/mdashboard/tIndex';class App extends Component { render() { return ( <Switch> // 无需权限 + <Route path="/mdashboard" exact component={MDashboard} /> <Route path="/" exact component={Login} /> <Route path="/ssh" exact component={WebSSH} /> <Route component={Layout} /> </Switch> ); }}// src\routes.js+ import MyDashboardIndex from './pages/mdashboard';export default [ {icon: <DesktopOutlined/>, title: '工作台', path: '/home', component: HomeIndex}, { icon: <DashboardOutlined/>, title: 'Dashboard', auth: 'dashboard.dashboard.view', path: '/dashboard', component: DashboardIndex },+ // 我的仪表盘+ {+ icon: <DashboardOutlined />,+ title: 'MyDashboard',+ auth: 'mydashboard.mydashboard.view',+ path: '/mydashboard',+ component: MyDashboardIndex+ },新建仪表盘组件。一个需要权限访问,另一个无需权限即可访问,故将仪表盘提取成一个单独的文件:
// src\pages\mdashboard\Dashboard.jsimport React from 'react';export default function () { return ( <div>仪表盘</div> )}// src\pages\mdashboard\index.jsimport React from 'react';import { AuthDiv } from 'components';import Dashboard from './Dashboard';export default function () { return ( <section> // AuthDiv 是 spug 封装的与权限相关的组件 <AuthDiv auth="testdashboard.testdashboard.view"> <p>需要权限才能访问</p> <Dashboard /> </AuthDiv> </section> )}// src\pages\mdashboard\tIndex.jsimport React from 'react';import Dashboard from './Dashboard';export default function () { return ( <section> <p>无需权限也能访问</p> <Dashboard /> </section> )}重启服务,倘若能访问,说明一切就绪,只差仪表盘核心代码。
访问 /mydashboard: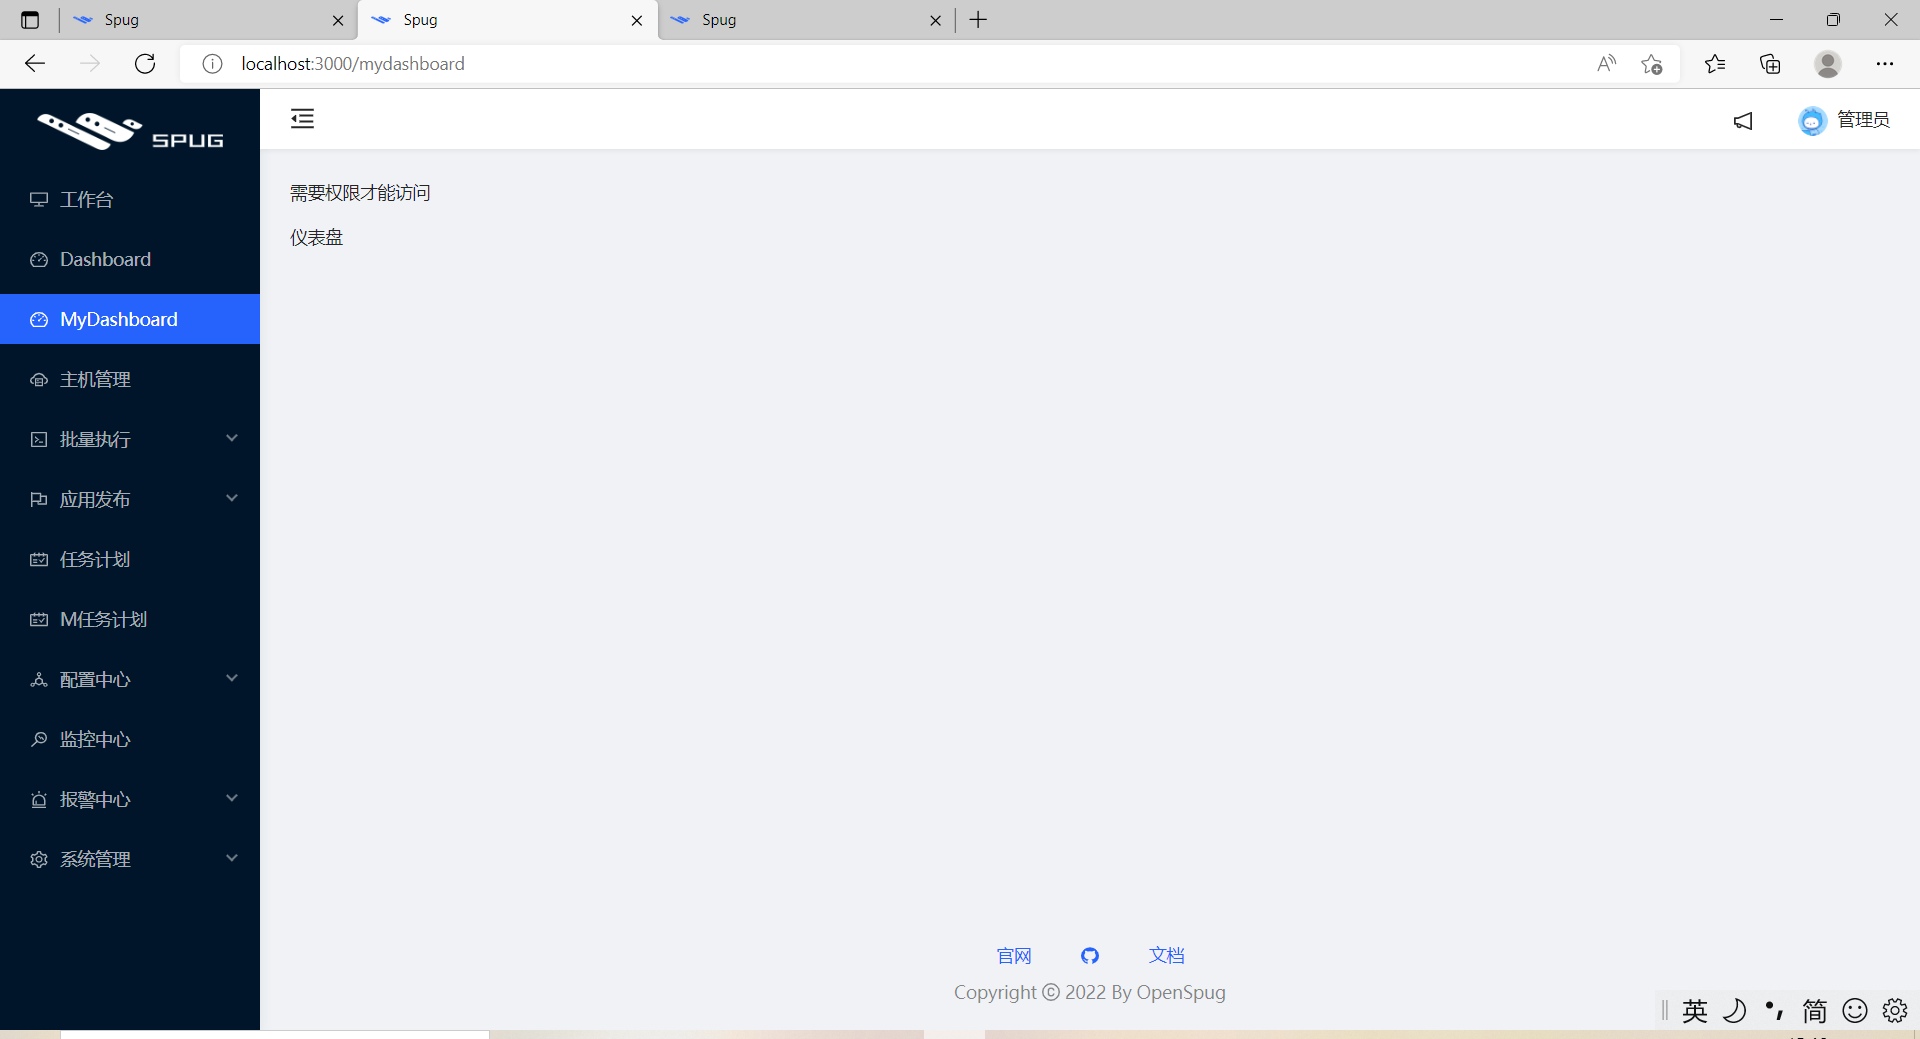
访问 /mdashboard: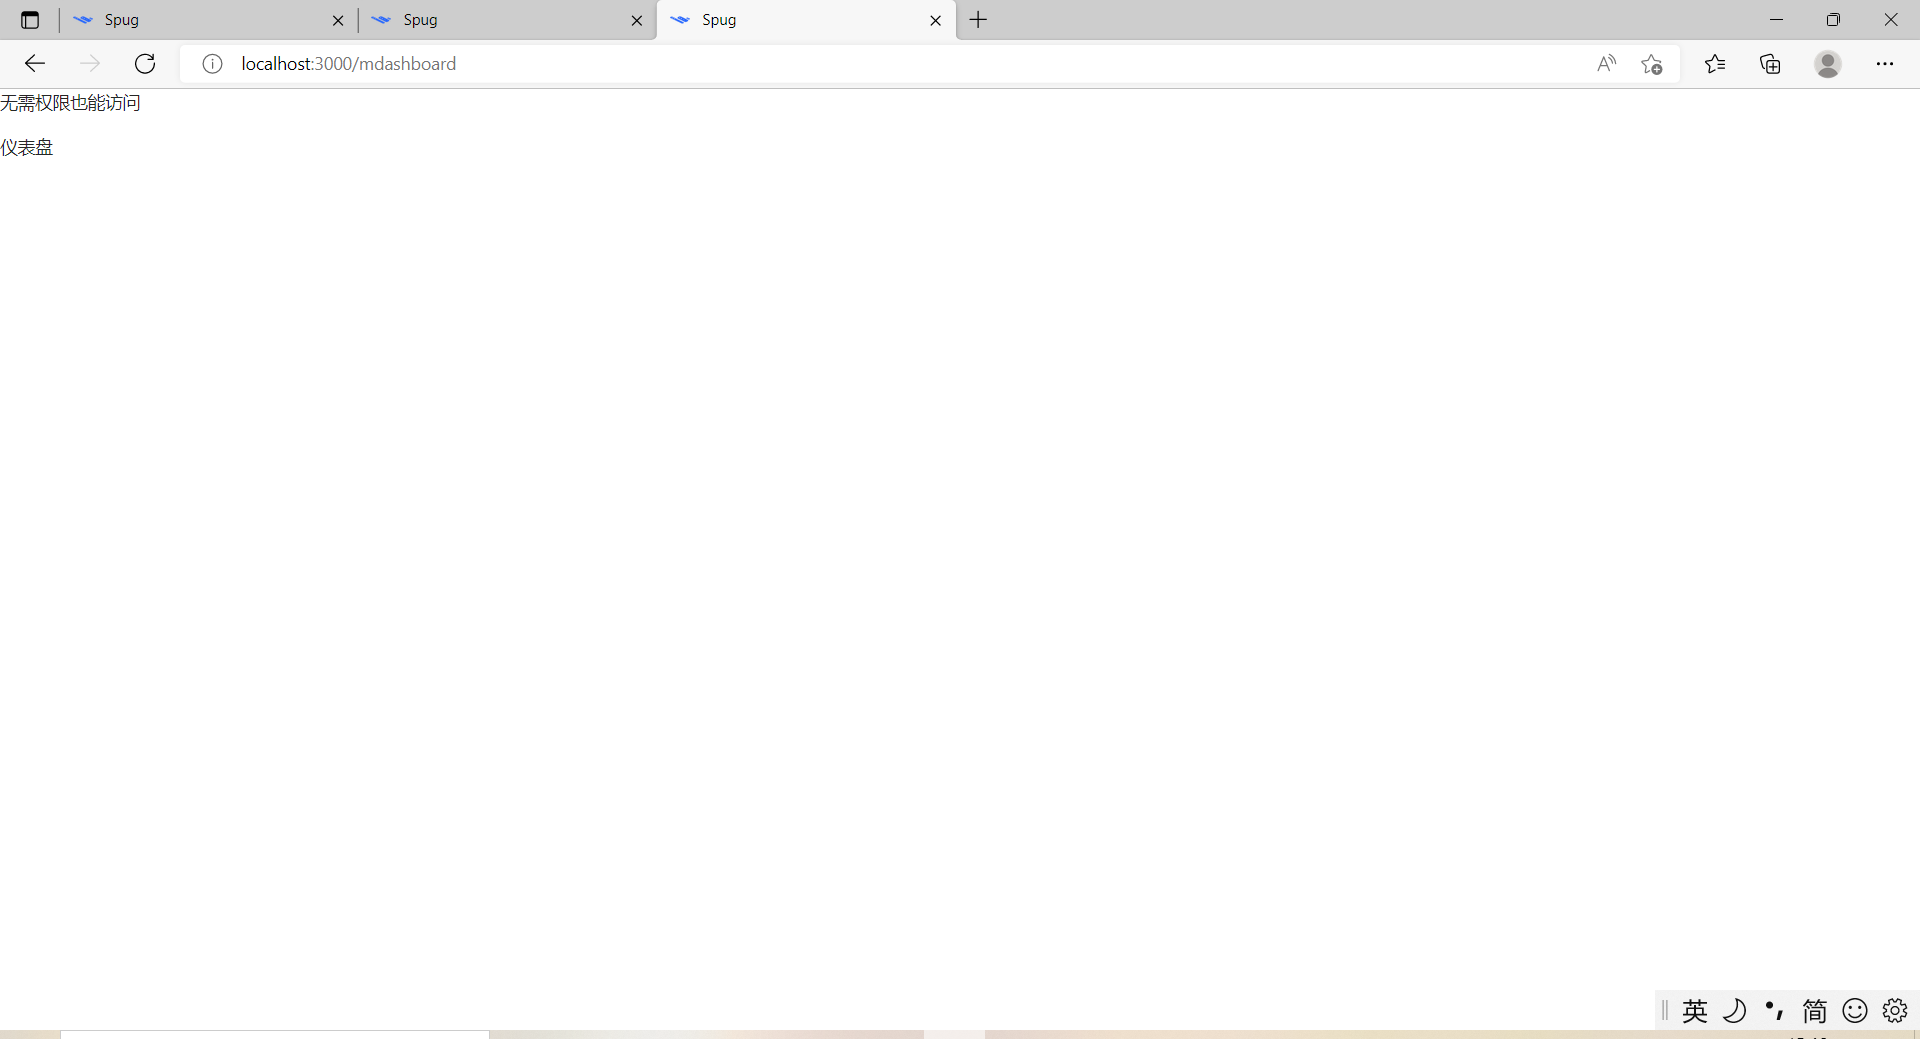
// src\pages\mdashboard\index.module.less.tdashboardBox { .react{ width: 10px; height: 10px; display: inline-block; background: #52c41a; /* #00000040 */ margin-left: 30px; margin-right: 10px; } // 参考:src\components\index.module.less 中 global :global(.trendBox .ant-card-head-wrapper) { width: 100%; }}// src\pages\mdashboard\Table.jsimport React from 'react';import { observer } from 'mobx-react';import { Descriptions } from 'antd';import { TableCard } from 'components';import store from './store';@observerclass ComTable extends React.Component { // 默认值 static defaultProps = { tableHeight: 353 } // scrollY 以外的高度 excludeScrollY = 120; componentDidMount() { store.fetchRecords() } columns = [{ title: 'id', dataIndex: 'id', },{ title: '名称', dataIndex: 'name', }, { title: '生产地', dataIndex: 'address', }, { title: '时间', dataIndex: 'time', }]; handleExpand = record => { return <Descriptions> <Descriptions.Item label="真数据">{record.time}</Descriptions.Item> <Descriptions.Item label="假数据">xxx</Descriptions.Item> <Descriptions.Item label="假数据xxx">xxxxxx</Descriptions.Item> <Descriptions.Item label="假数据xx">xxxxxxxxxxxxxxx</Descriptions.Item> <Descriptions.Item label="假数据xx">xxx</Descriptions.Item> <Descriptions.Item label="假数据xxxxxx"> xxxxx xxxxx xxxxxxxxxx xxxxxxxxx </Descriptions.Item> </Descriptions> } render() { console.log('this.props.tableHeight', this.props.tableHeight, 'y', this.props.tableHeight * this.scrollRadio) return ( <TableCard customStyles={{height: this.props.tableHeight}} title="水果信息" tKey="mt" rowKey="id" loading={store.isFetching} dataSource={store.dataSource} onReload={store.fetchRecords} actions={[]} scroll={{ y: this.props.tableHeight - this.excludeScrollY }} expandable={{ expandedRowRender: this.handleExpand, expandRowByClick: true }} size={'middle'} // 设为 false 时不展示和进行分页 pagination={false} columns={this.columns} /> ) }}export default ComTable// src\pages\mdashboard\Trend.jsimport React, { useState, useEffect } from 'react';import { Card, DatePicker, Modal } from 'antd';import { Chart, Geom, Axis, Tooltip, Legend } from 'bizcharts';import { http } from 'libs';import styles from './index.module.less'// 日期相关的库,比如最近30天等import moment from 'moment';/*bizcharts 官网:通过bx-tooltip插件自定义 为了满足更灵活多变的Tooltip自定义需求,提供bx-tooltip插件来实现ReactNode渲染,摆脱HTML模板的繁琐和死板*/import useCustTooltip from 'bx-tooltip';import { Typography, Space } from 'antd';import store from './store'export default function (props = { cardBodyHeight: 450 }) { // chart 高度占比 const chartHeightRatio = 0.888 const { Text, Link, Title } = Typography; const [loading, setLoading] = useState(true); // 本月第一天 —— 本月最后一天 // const [duration, setDuration] = useState([moment().startOf('month'), moment().endOf('month')]); // 最近三十天 const [duration, setDuration] = useState([moment().subtract(29, 'days'), moment()]); const [res, setRes] = useState([]); useEffect(() => { const strDuration = duration.map(x => x.format('YYYY-MM-DD')) setLoading(true); http.get('/api/mdashboard/occupancy_rate/', { duration: strDuration }) .then(res => { setRes(res) }) .finally(() => setLoading(false)) }, [duration]) // bx-tooltip插件的使用 const [BxChart, CustTooltip] = useCustTooltip.create(Chart, Tooltip); return ( // headStyle、bodyStyle 在这里都是用于适配(响应式) <Card className="trendBox" loading={loading} title="居住趋势" headStyle={store.cardTitleStyle} bodyStyle={{ height: props.cardBodyHeight }} extra={( <div> <DatePicker.RangePicker allowClear={false} style={{ width: 250 }} value={duration} onChange={val => setDuration(val)} /> </div> )}> <BxChart height={props.cardBodyHeight * chartHeightRatio} data={res} padding={[30, 120, 20, 60]} // 坐标轴展示不完整 scale={{ month: { range: [0.05, 0.99] }, per: { alias: '居住率', range: [0, 0.95], minTickInterval: 10, max: 100, min: 0 } }} // 强制适应(PS:只会对宽度有响应式,高度没有) forceFit > <Legend position="right-center" allowAllCanceled={true} itemFormatter={val => { const maxNum = 10 return val.length > maxNum ? val.split('').slice(0, maxNum - 3).join('') + '...' : val }} /> {/* x 坐标格式化 */} <Axis name="month" label={{ formatter(text, item, index) { // 格式化:2022-01-01 -> 0101 return `${text.split('-').slice(1).join('')}`; } }} /> <Axis name="per" title /> {/* 自定义 tooltip */} <CustTooltip enterable > {(title, items) => { return <div> { items.map((x, i) => { let oData = x.point._origin return <div> {Object.is(i, 0) && <Title level={5}>{oData.month}</Title>} <section style={{ marginTop: '20px' }}> <Title style={{ color: x.color, fontWeight: 'bold' }} level={5}>{oData.city}</Title> <Space direction="vertical" size={2}> <Text>幸福指数:{oData.happiness}</Text> <Link href="hello" target="_blank"> 跳转 </Link> <Link onClick={() => { Modal.info({ title: 'title', content: oData.msg1 }); }}> 详情 </Link> </Space> </section> </div> }) } </div> }} </CustTooltip> <Geom type="line" position="month*per" // 两条线 size={2} // 使线条平滑 // shape={"smooth"} color={"city"} /> </BxChart> </Card> )}// src\pages\mdashboard\PieChart.jsimport React from 'react';import { Typography} from 'antd';import { Chart, Geom, Axis, Tooltip, Coord, Label, Legend} from 'bizcharts';import DataSet from '@antv/data-set';// chartHeight 默认高度 250px ,用于适配export default function (props = {chartHeight: 250}) { const { Text } = Typography; const { DataView } = DataSet; const data = [ { item: '苹果', count: 10, }, { item: '梨子', count: 20, }, ]; const dv = new DataView(); dv.source(data).transform({ type: 'percent', field: 'count', dimension: 'item', as: 'percent', }); const cols = { percent: { formatter: val => { val = val * 100 + '%'; return val; }, }, }; function getXY(c, { index: idx = 0, field = 'percent', radius = 0.5 }) { const d = c.get('data'); if (idx > d.length) return; const scales = c.get('scales'); let sum = 0; for (let i = 0; i < idx + 1; i++) { let val = d[i][field]; if (i === idx) { val = val / 2; } sum += val; } const pt = { y: scales[field].scale(sum), x: radius, }; const coord = c.get('coord'); let xy = coord.convert(pt); return xy; } return ( <section> <Text>统计苹果和梨子</Text> <Chart height={props.chartHeight} // 内容显示不完整(见 bizcharts 实战部分) padding={[20, 150, 20, 40]} data={dv} scale={cols} forceFit onGetG2Instance={c => { const xy = getXY(c, { index: 0 }); c.showTooltip(xy); }} > <Legend position="right-center" /> <Coord type="theta" radius={1} /> <Axis name="percent" /> <Tooltip showTitle={false} itemTpl='<li><span ></span>{name}: {value}</li>' /> <Geom type="intervalStack" position="percent" color="item" tooltip={[ 'item*percent', (item, percent) => { // 处理 33.33333333% -> 33.33 percent = (percent * 100).toFixed(2) + '%'; return { name: item, value: percent, }; }, ]} style={{ lineWidth: 1, stroke: '#fff', }} > <Label content="count" formatter={(val, item) => { return item.point.item + ': ' + val; }} /> </Geom> </Chart> </section> );}// src\pages\mdashboard\BarChart.jsimport React from "react";import { Typography, Space } from 'antd'import { Chart, Geom, Axis, Tooltip, Coord, Legend,} from "bizcharts";import useCustTooltip from 'bx-tooltip';import DataSet from "@antv/data-set";export default function (props = {barHeight: 240}) { const [BxChart, CustTooltip] = useCustTooltip.create(Chart, Tooltip); const { Text,Title } = Typography; const retains = ["State", '总比例', 'bad', 'good', 'Total'] const fields = ["好的比例", "坏的比例"] const data = [ { State: "苹果(红富士、糖心苹果)", good: 50, bad: 150, Total: 200, 好的比例: 25, 坏的比例: 75, 总比例: 100 }, { State: "梨子(香梨)", good: 75, bad: 125, Total: 200, 好的比例: 37.5, 坏的比例: 62.5, 总比例: 100 }, ]; const ds = new DataSet(); const dv = ds.createView().source(data); dv.transform({ type: "fold", fields: fields, key: "比例", value: "百分总计", retains: retains // 保留字段集,默认为除fields以外的所有字段 }); return ( <section> <Text>堆叠柱状图</Text> <BxChart height={props.barHeight} data={dv} padding={[30, 80, 20, 40]} forceFit> <Legend position="right-center" /> <Coord /> <Axis name="State" label={{ offset: 12, formatter(text, item, index) { // 最多显示 10 个,多余省略。详细的在 tooltip 中显示 const maxNum = 10 return text.length > maxNum ? text.split('').slice(0, maxNum - 3).join('') + '...' : text } }} /> <CustTooltip enterable > {(title, items) => { return <div> { items.map((x, i) => { // 取得原始数据 let oData = x.point._origin return <div> {Object.is(i, 0) && <Title level={5}>{oData.State}</Title>} <section style={{ marginTop: '20px' }}> <Space direction="vertical" size={2}> <Text style={{ color: x.color, fontWeight: 'bold' }}>{oData['比例']}:{oData['百分总计']}%</Text> <Text>good数量:{oData['good']}</Text> <Text>bad数量:{oData['bad']}</Text> <Text>总数量:{oData['Total']}</Text> </Space> </section> </div> }) } </div> }} </CustTooltip> <Geom type="intervalStack" position="State*百分总计" color={"比例"} > </Geom> </BxChart> </section> );}// src\pages\mdashboard\store.jsimport { observable, computed } from 'mobx';import http from 'libs/http';const PADDING = 16class Store { // 表格数据 @observable records = []; // 是否正在请求数据 @observable isFetching = false; // 数据源 @computed get dataSource() { return this.records } fetchRecords = () => { this.isFetching = true; http.get('/api/mdashboard/table') // todo 接口格式或许会调整 .then(res => this.records = res) .finally(() => this.isFetching = false) }; /* 适配相关 */ // 盒子高度,padding 用于给顶部和底部留点空隙。 // 由于笔者没有设计,所以先用 px 实现,之后在在将固定高度改为响应式,937 是固定高度实现后测量出的高度。 @observable baseBoxHeight = 937 - PADDING @observable padding = PADDING // 需要用 this 调用 padding 变量,即 `this.padding` @observable boxHeight = window.innerHeight - this.padding * 2 // 饼图高度比例 @observable pieBoxRatio = 0.20 // 柱状图高度比例 @observable barBoxRatio = 0.23 // “My Dashboard 我的仪表盘” @computed get TitleHeight() { const ratio = 80 / this.baseBoxHeight return this.boxHeight * ratio } // 运行card高度 @computed get todayCardHeight() { const ratio = 75 / this.baseBoxHeight return this.boxHeight * ratio } // “饼图+描述列表+柱状图” body 高度 @computed get statisticBodyHeight() { const ratio = 660 / this.baseBoxHeight return this.boxHeight * ratio } // 居住趋势 body 的 @computed get trendBodyBodyHeight() { const ratio = 385 / this.baseBoxHeight return this.boxHeight * ratio } // 水果信息高度 @computed get configTableHeight() { const ratio = 353 / this.baseBoxHeight return this.boxHeight * ratio } // xys16 得用 computed 才会联动。下面这种写法不会联动 // @observable xys16 = (16 / this.baseBoxHeight) * this.boxHeight @computed get xys16() { return (16 / this.baseBoxHeight) * this.boxHeight } @computed get xys12() { return (12 / this.baseBoxHeight) * this.boxHeight } @computed get xys36() { return (36 / this.baseBoxHeight) * this.boxHeight } @computed get xys24() { return (24 / this.baseBoxHeight) * this.boxHeight } @computed get xys78() { return (78 / this.baseBoxHeight) * this.boxHeight } @computed get pieBoxHeight() { return this.pieBoxRatio * this.boxHeight } @computed get barBoxHeight() { return this.barBoxRatio * this.boxHeight } // card 的 header @computed get cardTitleStyle() { const cardTitleRatio = 57 / this.baseBoxHeight return { display: 'flex', height: this.boxHeight * cardTitleRatio, alignItems: 'center', justifyContent: 'center' } } /* /适配相关 */}export default new Store()// src\pages\mdashboard\Dashboard.jsimport React, {useEffect, Fragment} from 'react';import { Row, Col, Card, Descriptions, Typography, Divider } from 'antd';import AlarmTrend from './Trend';import Piechart from './PieChart'import CusTable from './Table';import CusBarChart from './BarChart';import Styles from './index.module.less'import { observer } from 'mobx-react';import store from './store'export default observer(function () { // Typography排版 const { Text } = Typography; useEffect(() => { // 响应式 window.addEventListener("resize", function(){ // padding,用于留点间距出来 store.boxHeight = window.innerHeight - store.padding * 2 }, false); }, []) return ( // Fragment 用于包裹多个元素,却不会被渲染到 dom <Fragment> {/* 使用单一的一组 Row 和 Col 栅格组件,就可以创建一个基本的栅格系统,所有列(Col)必须放在 Row 内。 */} <Row style={{ marginBottom: store.xys16 }}> <Col span={24}> {/* 可以省略 px */} {/* 如果将字体和padding 改为响应式,height 设置或不设置还是有差别的,设置 height 会更准确 */} <Card bodyStyle={{display: 'flex', height: store.TitleHeight, justifyContent: 'center', padding: store.xys12, fontSize: store.xys36, fontWeight: 700, }}> <Text>My Dashboard 我的仪表盘</Text> </Card> </Col> </Row> <Row gutter={16}> <Col span={8}> {/* gutter:水平垂直间距都是 响应式 16 */} <Row gutter={[store.xys16, store.xys16]}> {/* 24 栅格系统。 */} <Col span={24}> {/* 垂直居中 */} <Card bodyStyle={{ display: 'flex', height: store.todayCardHeight, alignItems: 'center'}}> {/* 文字大小 */} <span> <Text style={{ fontSize: store.xys16}}> 运行为绿色,否则为灰色: <span className={Styles.react}></span> <span>运行</span> </Text> </span> </Card> </Col> <Col span={24}> <Card title="饼图+描述列表+柱状图" headStyle={store.cardTitleStyle} bodyStyle={{height: store.statisticBodyHeight}}> <Piechart chartHeight={store.pieBoxHeight}/> <Divider style={{margin: `${store.xys12}px 0`}}/> {/* Descriptions描述列表,常见于详情页的信息展示。这里总是显示两列。 */} {/* spug 中“Dashboard”的“最近30天登录”是用的就是Descriptions,缺点是不像 table 对齐。当文字长度不同,会看起来错乱。 */} {/* 样式,用于适配,即垂直居中 */} <Descriptions column={2} style={{display: 'flex', alignItems: 'center', minHeight: store.xys78}}> <Descriptions.Item label="Descriptions">描述列表</Descriptions.Item> <Descriptions.Item label="梨子">5个</Descriptions.Item> <Descriptions.Item label="购买时间">2022-04-21</Descriptions.Item> <Descriptions.Item label="购买途径"> <Text style={{ width: 100 }} ellipsis={{ tooltip: '看不完整就将鼠标移上来' }}> 看不完整就将鼠标移上来 {/* 超A、超B、超C、超D, */} </Text> </Descriptions.Item> </Descriptions> <Divider style={{margin: `${store.xys12}px 0`}}/> <CusBarChart barHeight={store.barBoxHeight}/> </Card> </Col> </Row> </Col> <Col span={16} > <Row gutter={[store.xys16, store.xys16]}> <Col span={24}> <AlarmTrend cardBodyHeight={store.trendBodyBodyHeight}/> </Col> <Col span={24}> <CusTable tableHeight={store.configTableHeight}/> </Col> </Row> </Col> </Row> </Fragment> )})// src\pages\mdashboard\index.jsimport React from 'react';import { AuthDiv } from 'components';import Dashboard from './Dashboard';import styles from './index.module.less'export default function () { return ( <section className={styles.tdashboardBox}> <AuthDiv auth="testdashboard.testdashboard.view"> <Dashboard /> </AuthDiv> </section> )}// src\pages\mdashboard\tIndex.js// 无需权限即可访问import React from 'react';import Dashboard from './Dashboard';import store from './store';import styles from './index.module.less'export default function () { return ( <section className={styles.tdashboardBox} style={{padding: `${store.padding}px 16px`, backgroundColor: 'rgb(125 164 222)', height: '100vh'}}> <Dashboard/> </section> )}重启服务,效果如下:
bizcharts 是阿里的一个图表组件库。
注:spug 项目中使用的版本是 3.x。参考文档时不要搞错。
上面我们安装的其中一个依赖包 bx-tooltip 就来自这里。
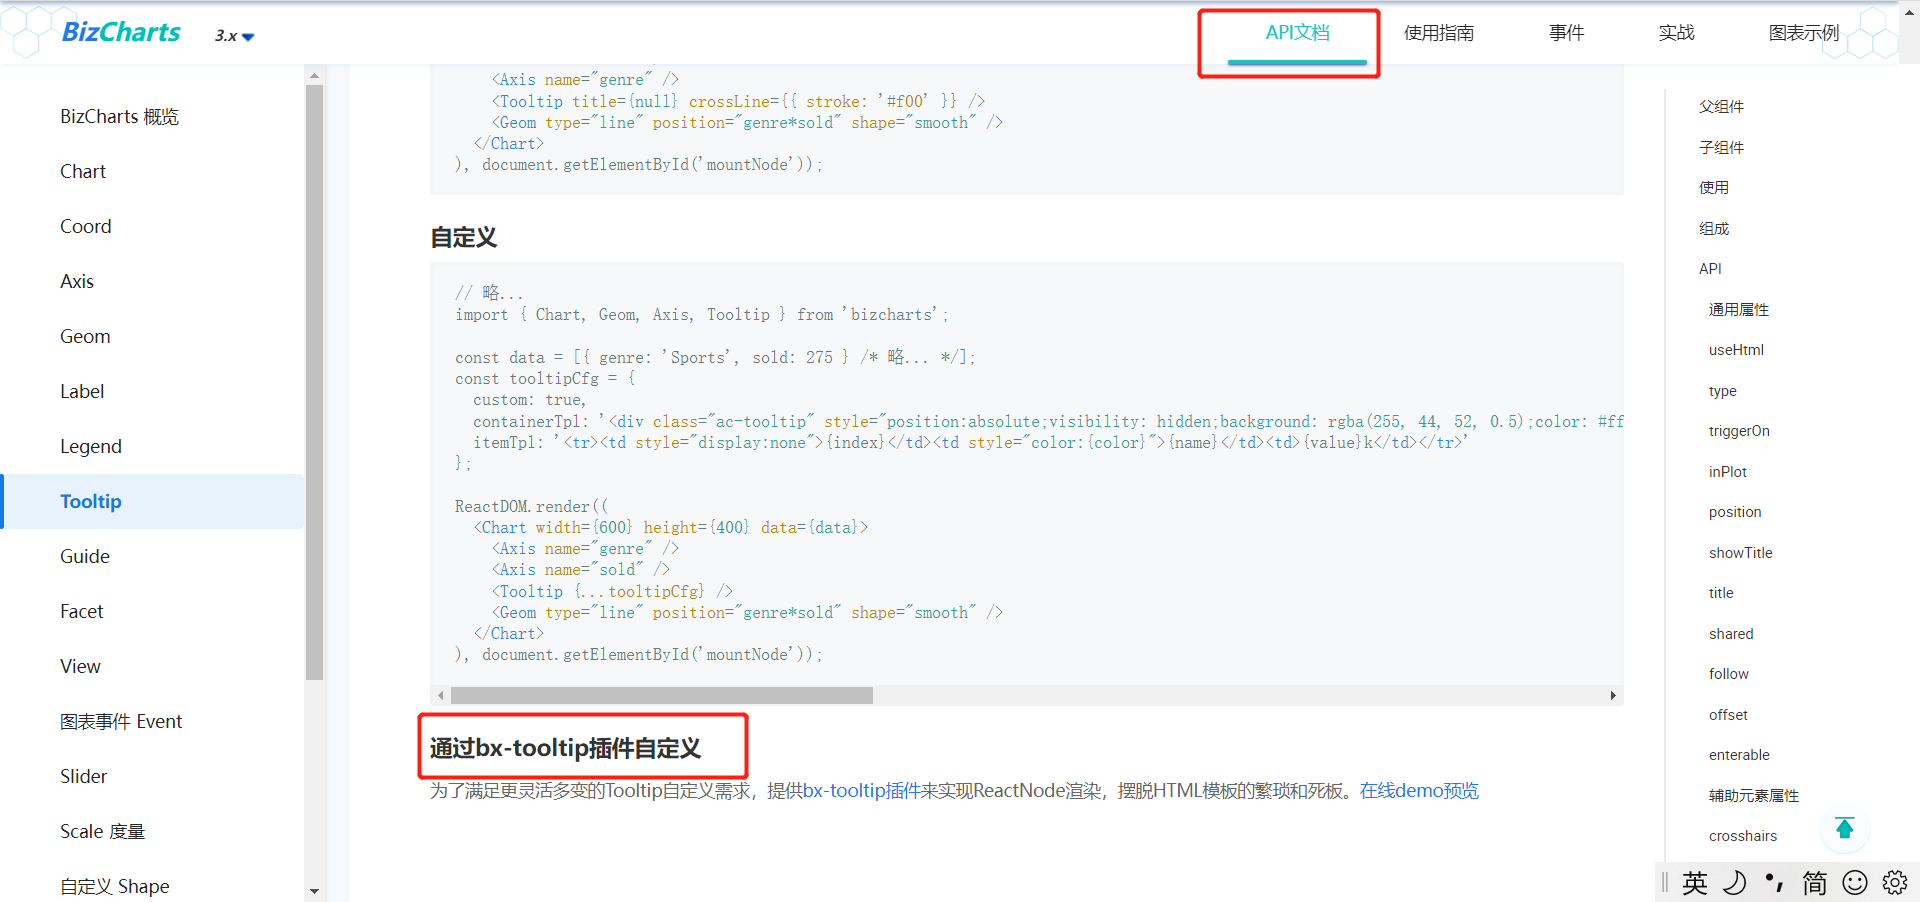
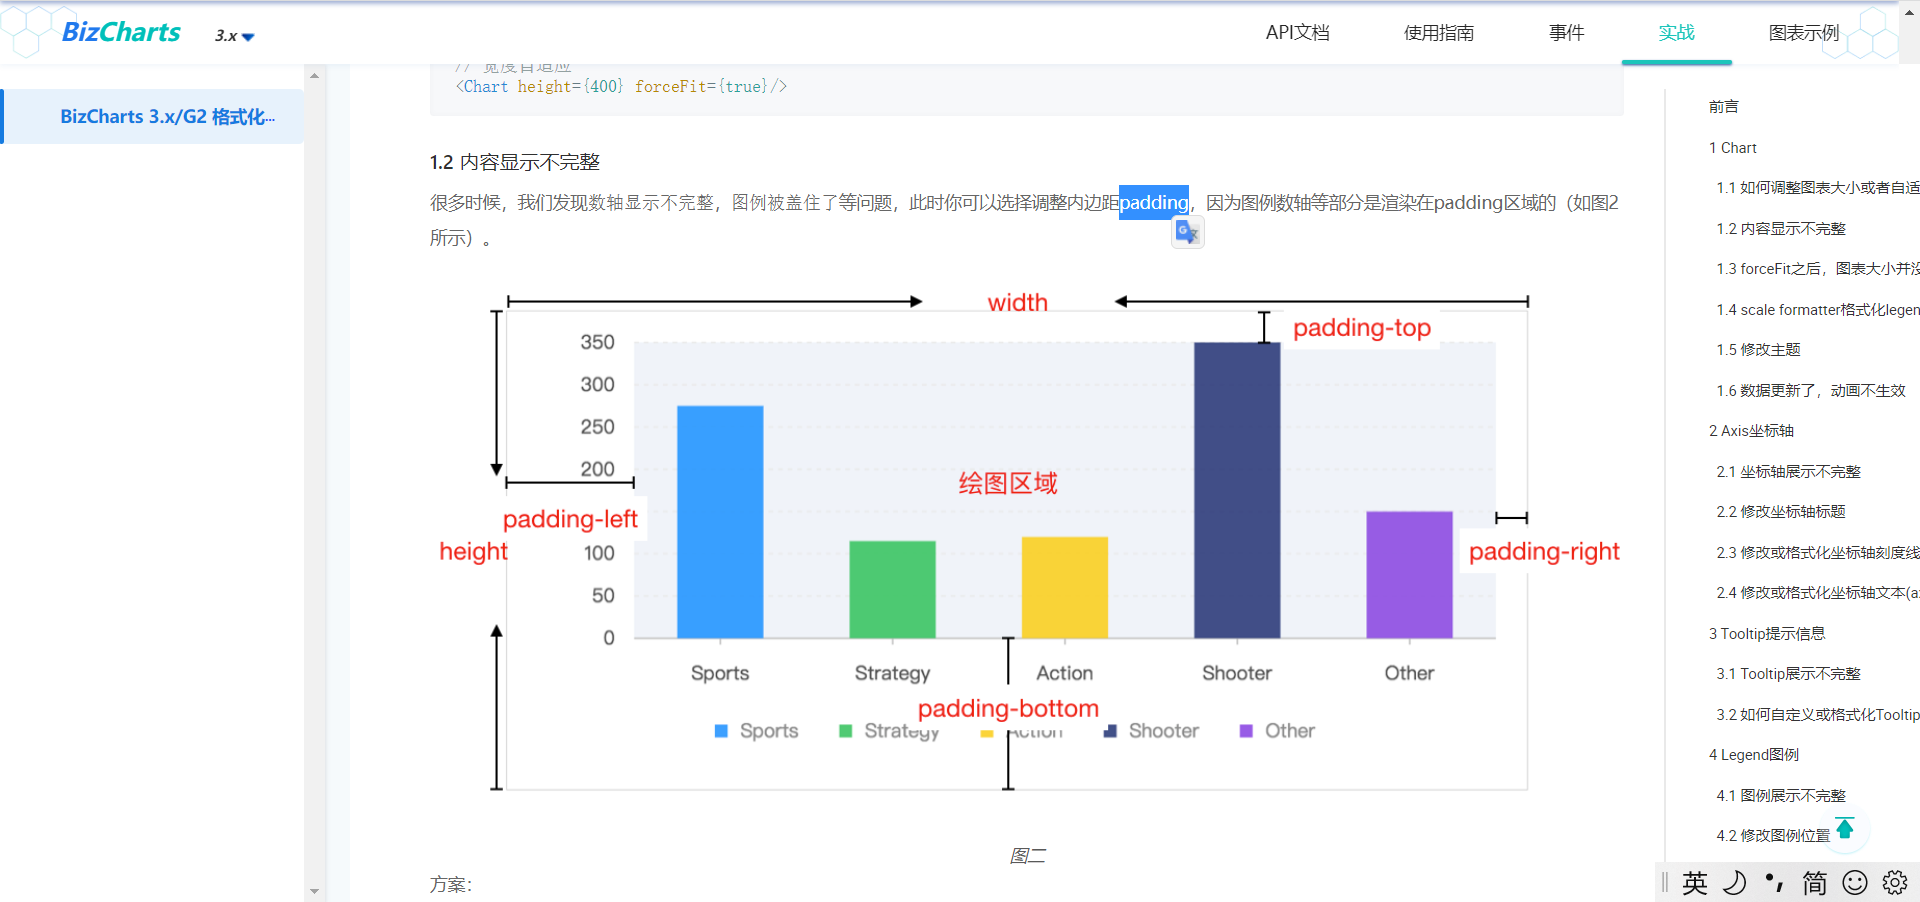
实战其实就是一些 bizcharts 使用上的一些答疑。例如“内容显示不完整”,有可能就是因为 padding 的原因。
例如我们使用的堆叠柱状图的用法示例就参考这里:
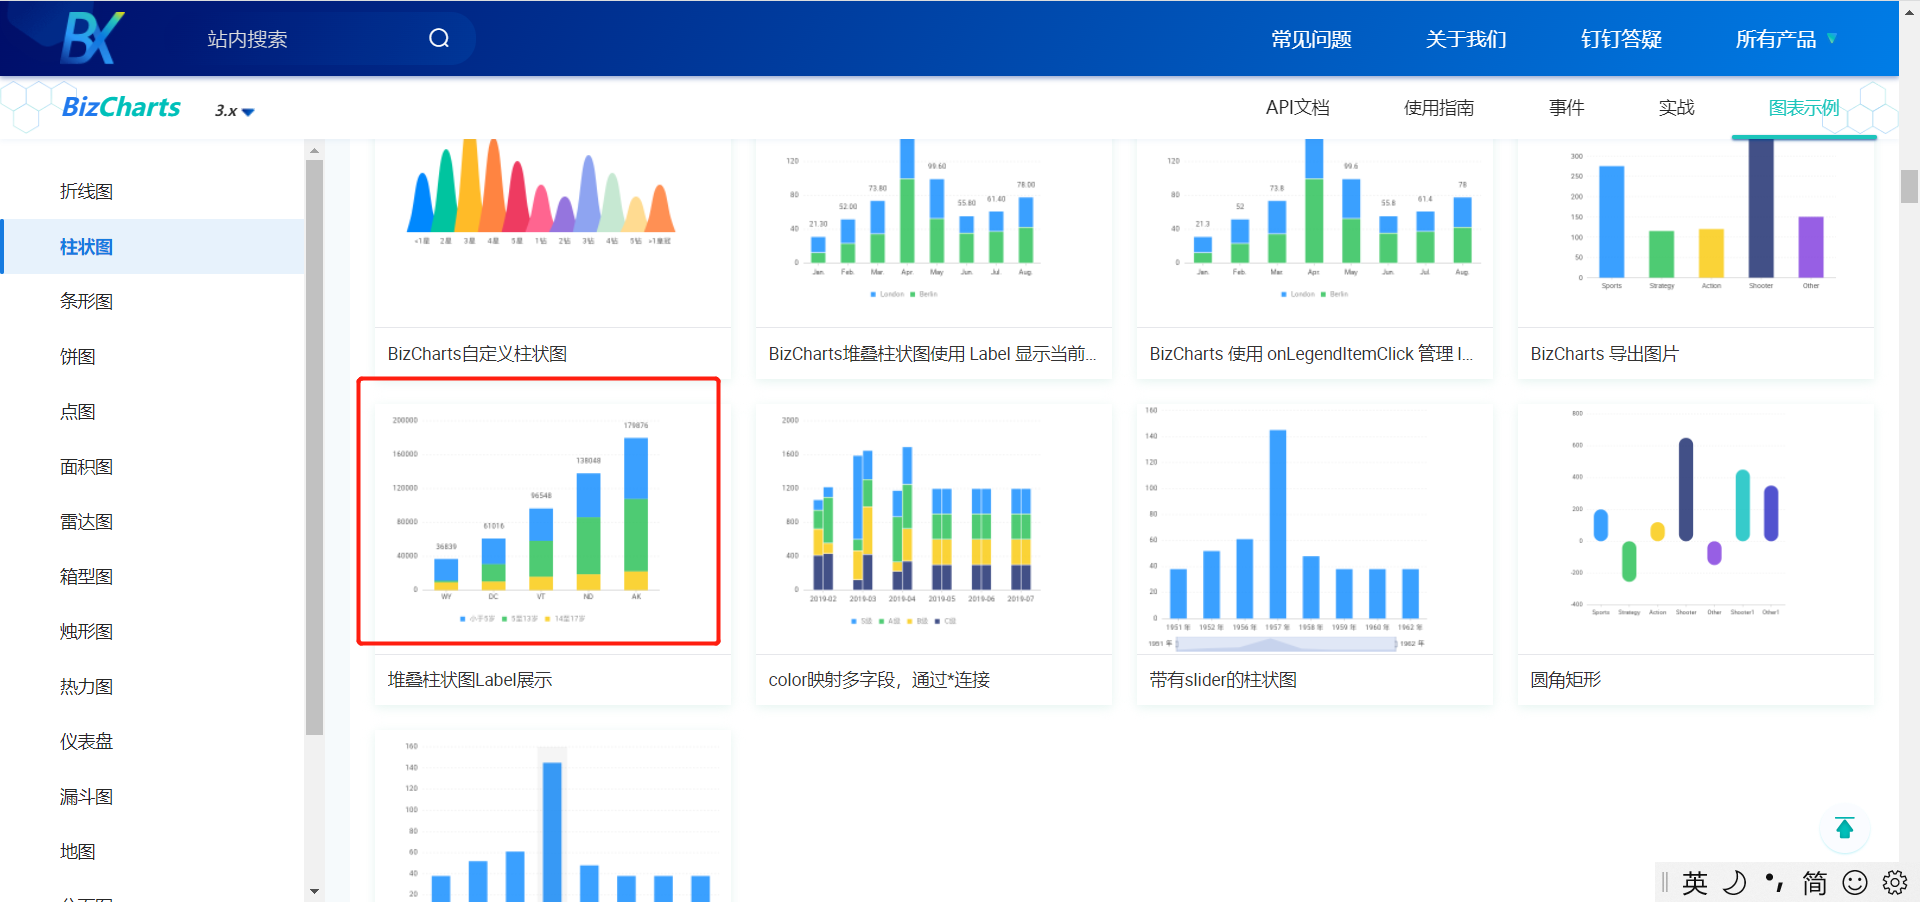
点击进入示例,修改左边源码,右侧显示也会同步,非常方便我们在线研究和学习: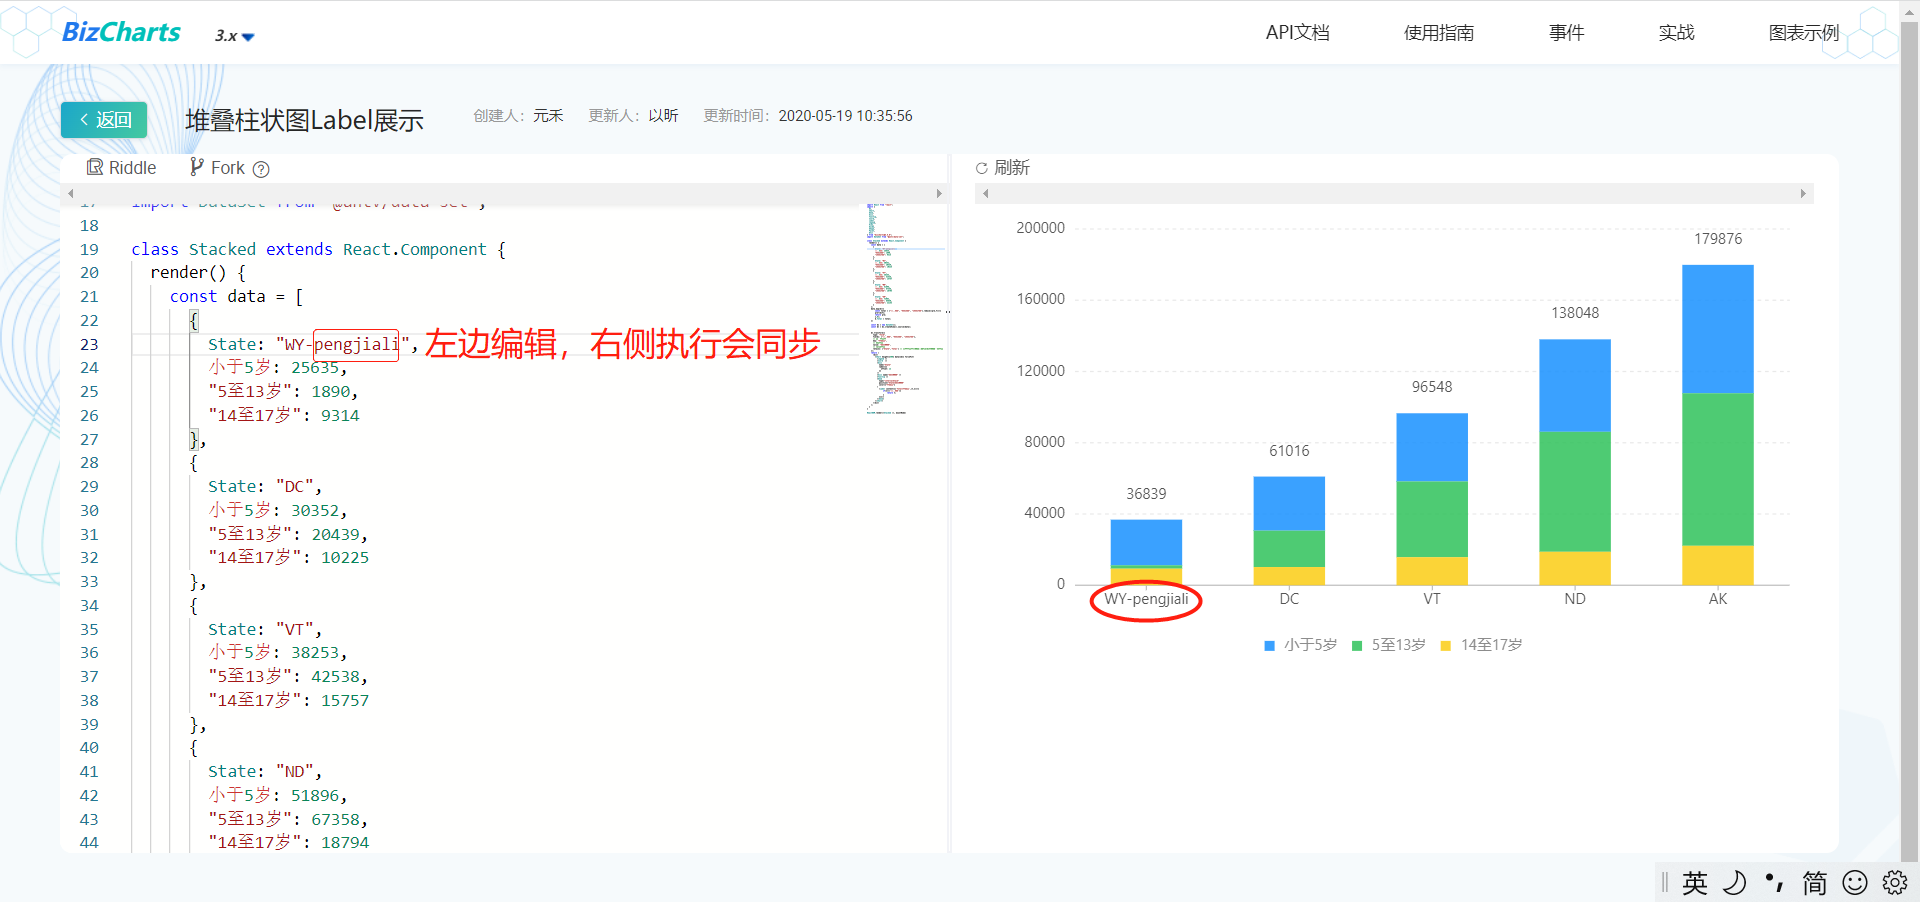
bizcharts 有宽度自适应,但没有实现高度的自适应。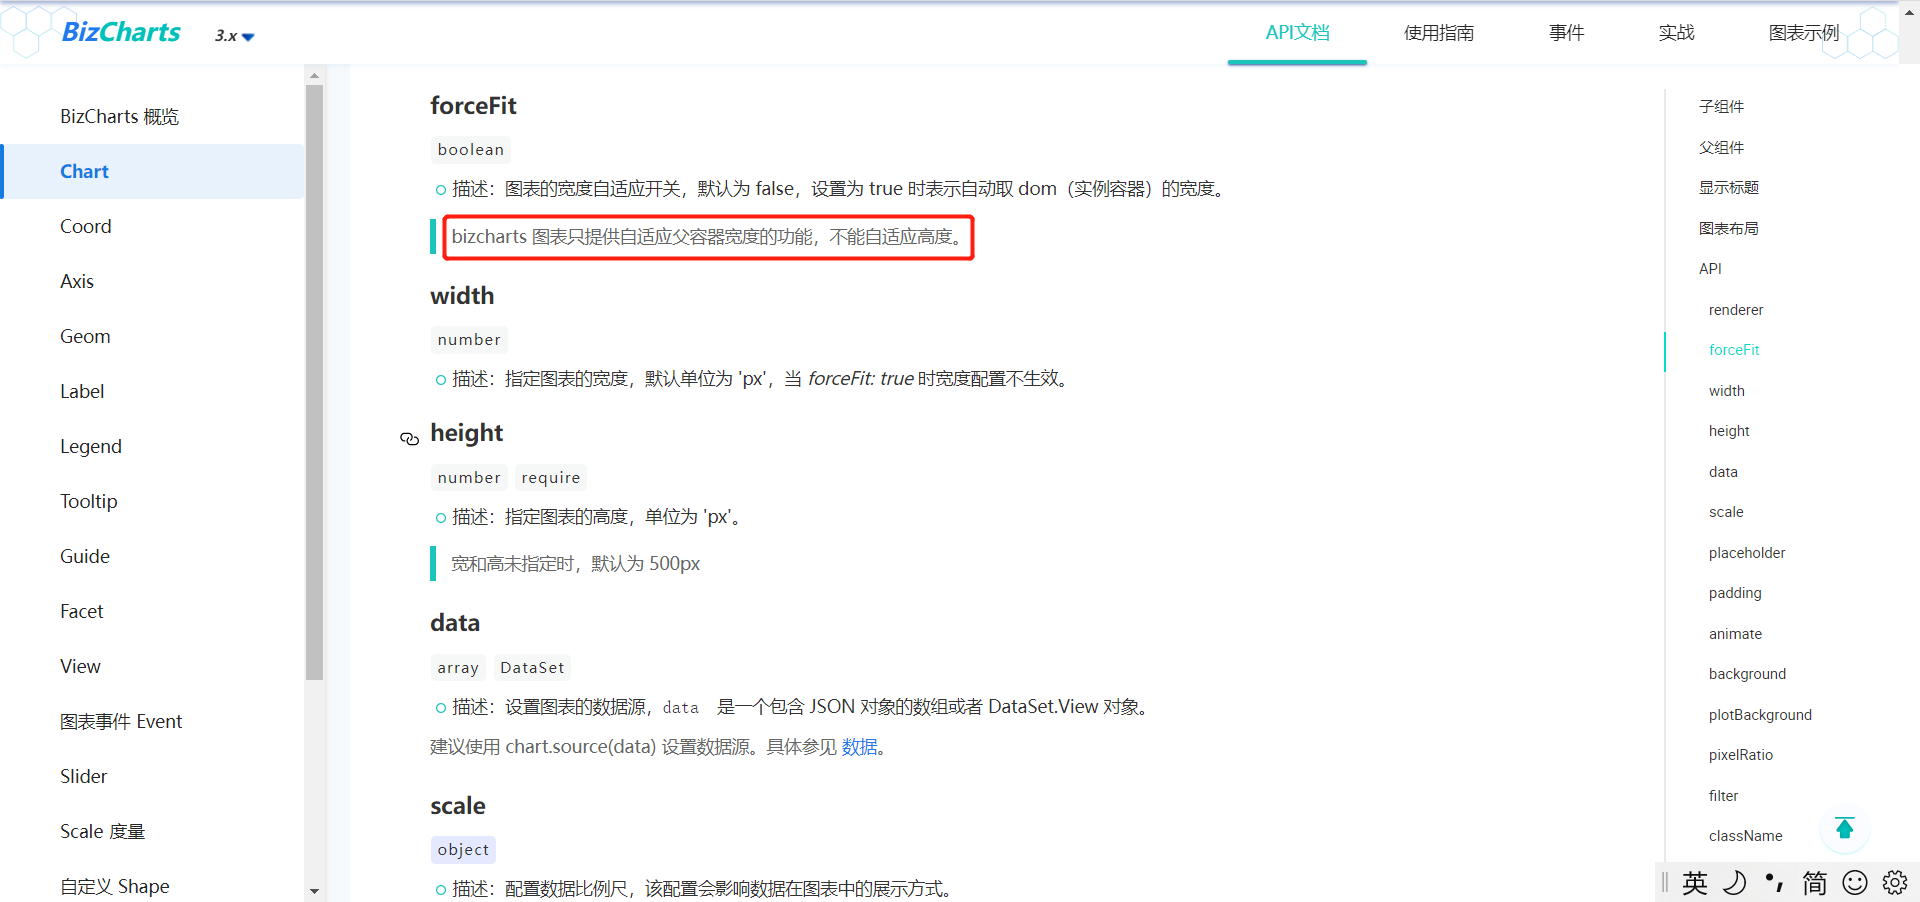
笔者高度自适应的做法:将高度全部改为百分比。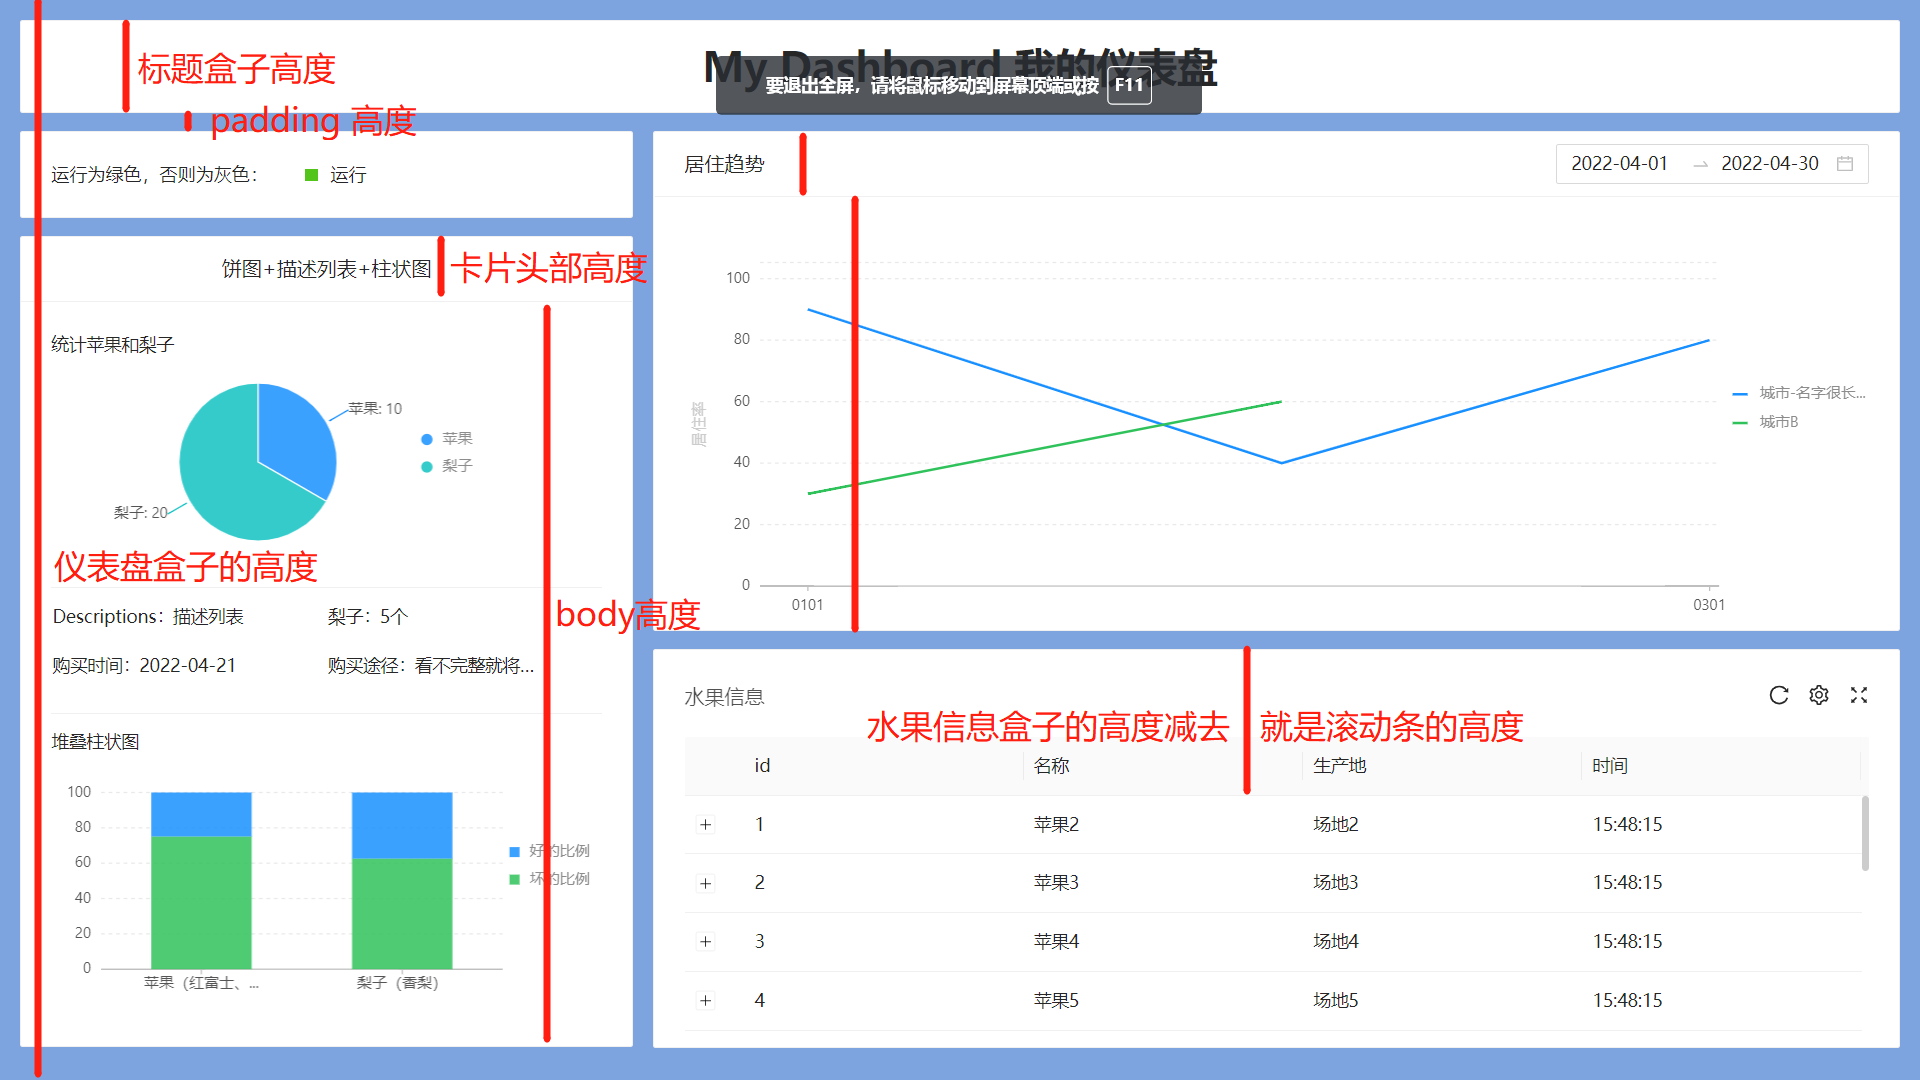
具体做法如下:
核心代码如下:
// src\pages\mdashboard\store.jsconst PADDING = 16class Store { @observable baseBoxHeight = 937 - PADDING @observable padding = PADDING // 仪表盘盒子高度 @observable boxHeight = window.innerHeight - this.padding * 2 // 饼图高度比例。根据之前的效果算出来的 @observable pieBoxRatio = 0.20 // 柱状图高度比例 @observable barBoxRatio = 0.23 // “My Dashboard 我的仪表盘” 高度 @computed get TitleHeight() { const ratio = 80 / this.baseBoxHeight return this.boxHeight * ratio } // 运行card高度 @computed get todayCardHeight() { const ratio = 75 / this.baseBoxHeight return this.boxHeight * ratio } // “饼图+描述列表+柱状图” body 高度 @computed get statisticBodyHeight() { const ratio = 660 / this.baseBoxHeight return this.boxHeight * ratio } // 居住趋势 body 的高度 @computed get trendBodyBodyHeight() { const ratio = 385 / this.baseBoxHeight return this.boxHeight * ratio } // xys16 得用 computed 才会联动。下面这种写法不会联动 @computed get xys16() { return (16 / this.baseBoxHeight) * this.boxHeight } // 饼状图盒子高度 @computed get pieBoxHeight() { return this.pieBoxRatio * this.boxHeight } // card 的 header 比例 @computed get cardTitleStyle() { const cardTitleRatio = 57 / this.baseBoxHeight return { display: 'flex', height: this.boxHeight * cardTitleRatio, alignItems: 'center', justifyContent: 'center' } }}实现过程中出现如下两个问题:一个是折线图的 Y 轴乱序,一个是堆叠柱状图有一节空白。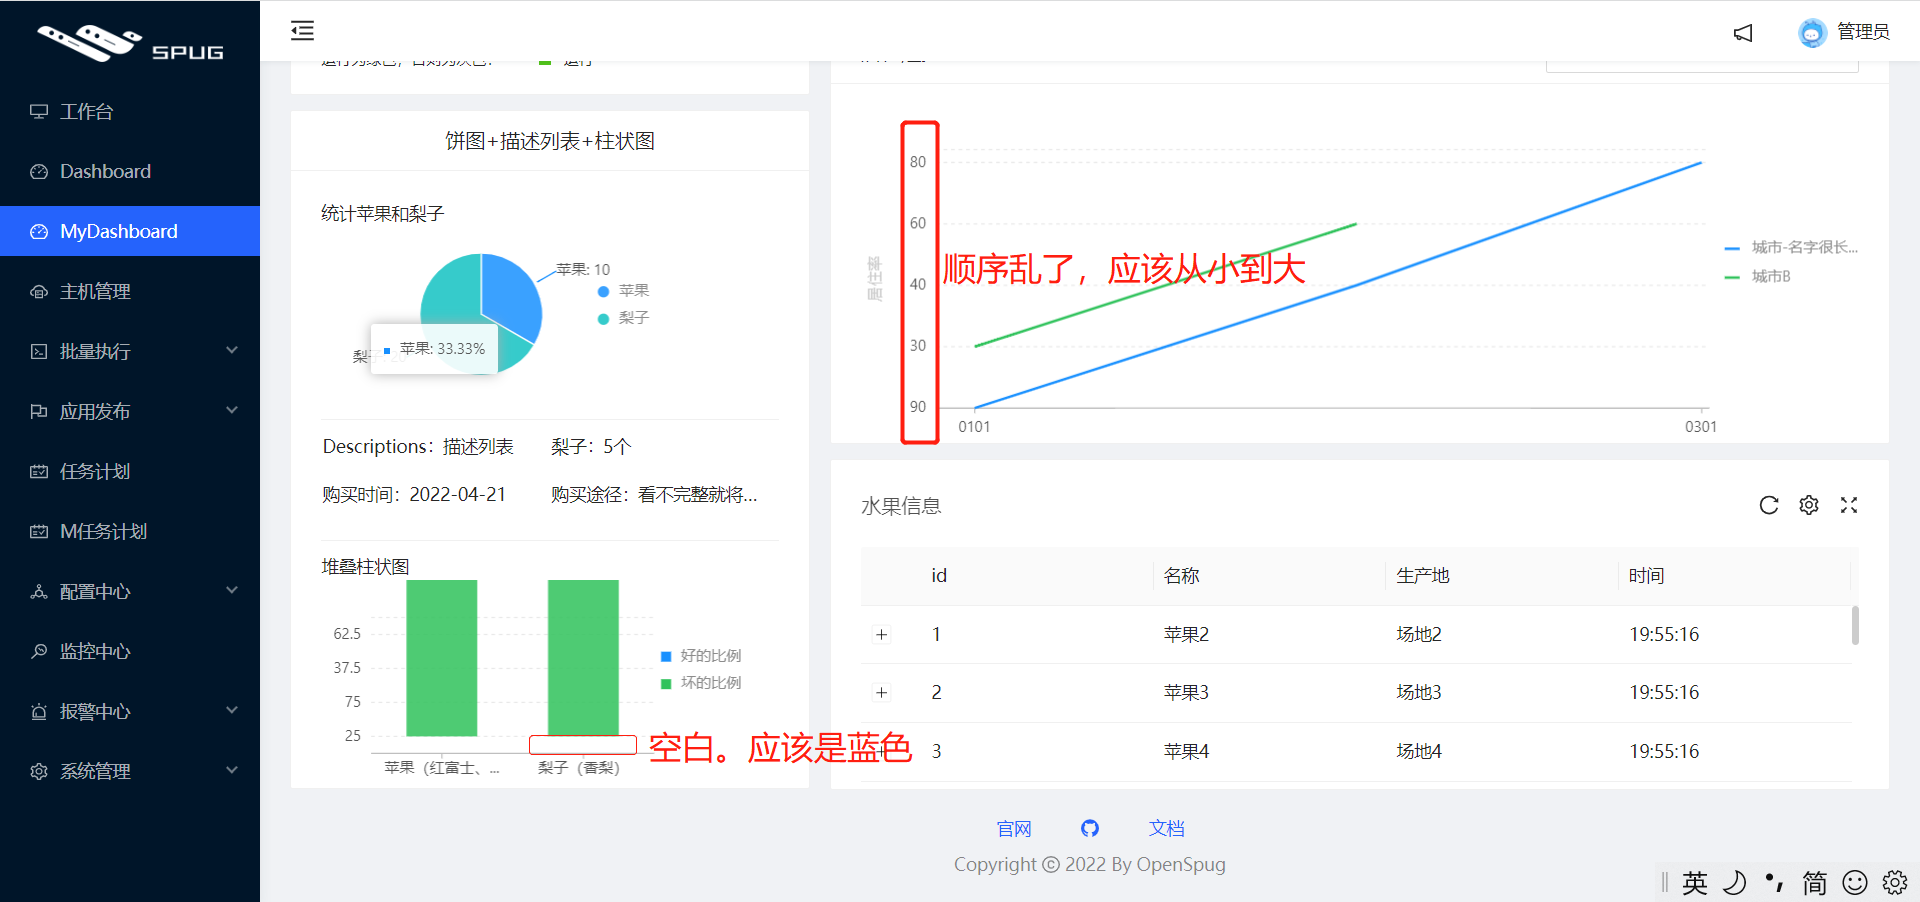
原因是值不小心弄成了字符串,改为数字类型即可。
其他章节请看:
react实战 系列